

Microsoft Fabric is an end-to-end Analytics Software-as-a-service offering. One of the editors and tools in Microsoft Fabric is Data Wrangler. Data Wrangler is a tool that provides the ability to work with data. In this article, I will explain the Data Wrangler, how to work with it, and how it can be used with other objects in Fabric, such as Lakehouse and Notebook.
Video
What is Microsoft Fabric
Microsoft Fabric is an end-to-end Data Analytics platform software-as-a-service from Microsoft. This platform uses multiple workloads to carry all services related to data analytics, such as data integration, storage, data warehousing, data engineering, Business intelligence, Data science, etc.

These are good starting points if you want to get yourself more familiar with Microsoft Fabric;
What is Data Wrangler?
There is a tool (or you can consider it as an editor) in Fabric for data scientists. As a data scientist, you must work with the data, clean it, group it, aggerate it, and do other data preparation work. This might be needed to understand the data or be part of the process you do to prepare the data and load it into a table for further analysis. Data Wrangler is a tool that gives you such ability. You can use it to transform data and prepare and even generate Python code to make this process part of a bigger data analytics project.
Data Wrangler has a simple-to-use graphical user interface that makes the job of a data scientist easier.
Getting Started with Data Wrangler
To understand the tool, it is easier to start working with it. This tool can connect to a data table and work with it. However, at the time of writing this article, the only way the data can be used in this tool is to load it into a DataFrame using Pandas.
Pandas
Pandas is one of the most popular libraries in Python to work with data. It gives you functions to read data from files or write it into files, plus functions to do many data transformations. To use the data in the Data Wrangler, First, you have to load the data into a DataFrame object in Pandas. DataFrame is like a data table. You can use the code below to get data from a file loaded into a DataFrame using a Notebook (To learn more about Notebook, read my article here);
# Welcome to your new notebook
# Type here in the cell editor to add code!
import pandas as pd

# Read an Excel file from your Lakehouse into a Pandas DataFrame
# Replace LAKEHOUSE_PATH and FILENAME with your own values
df = pd.read_excel("abfss://FabricTest@onelake.dfs.fabric.microsoft.com/AdventureWorks.Lakehouse/Files/AdventureWorksDW2012.xlsx",sheet_name="DimCustomer")
display(df)
I get data from an Excel file in a Lakehouse in the code above. The sheet that I get data from is called DimCustomer. The essential parts of the code above are the “import pandas”, which imports the Pandas library in the Notebook, and then the “read_excel” function, which reads data from an Excel file and loads it into a DataFrame called df.
Getting data from Lakehouse
There is a simpler way to generate the code above as well. If you already have a Lakehouse and a file (such as Excel, CSV, or paquet) in it, then you can use the Lakehouse Explorer so that it generates the code for you. To learn more about the Lakehouse, read my article here.
In the Lakehouse Explorer, you can right-click on a file, choose Load, and then Pandas.
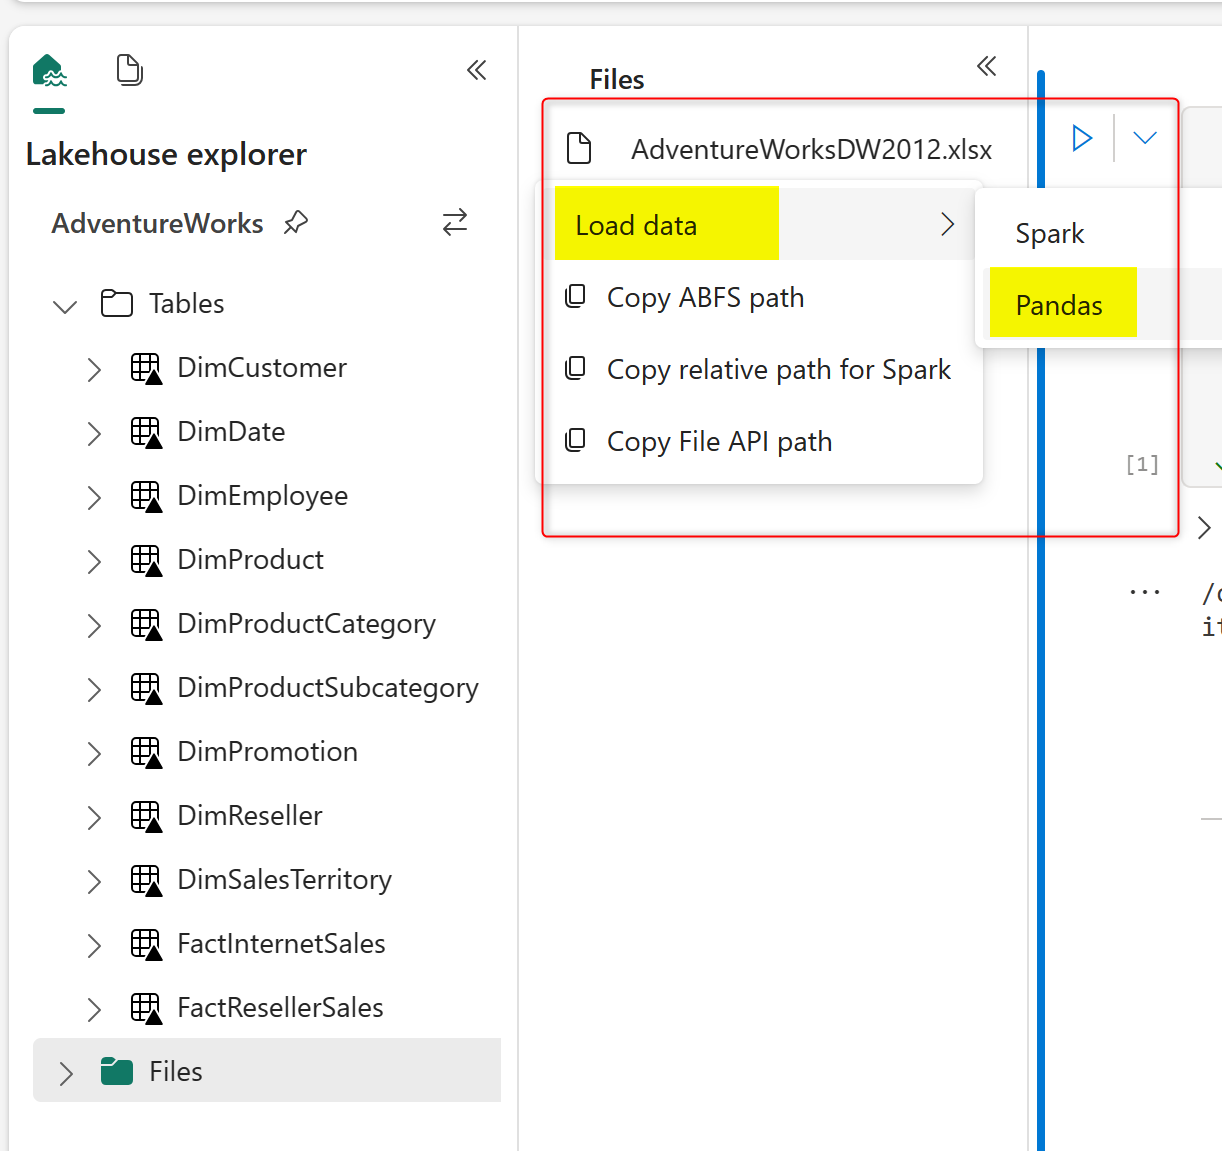
This will generate the code that loads data into Pandas DataFrame, making it ready to use Data Wrangler.
Data Wrangler; The Experience
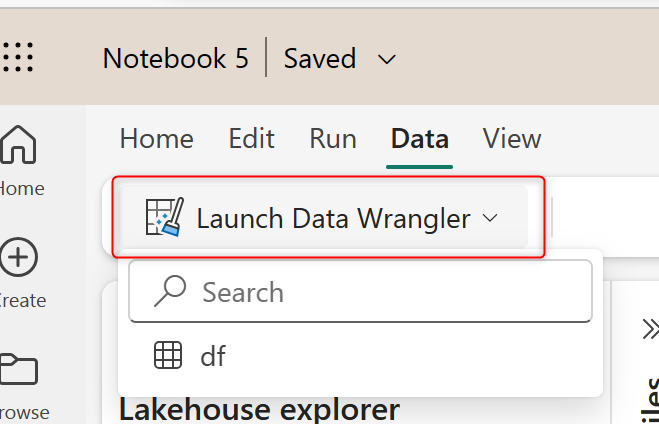
Now that the data is loaded into a Pandas DataFrame, you can click on the Data tab in the Notebook and Launch Data Wrangler. You can then choose the DataFrame for it. In my example, it is called df.
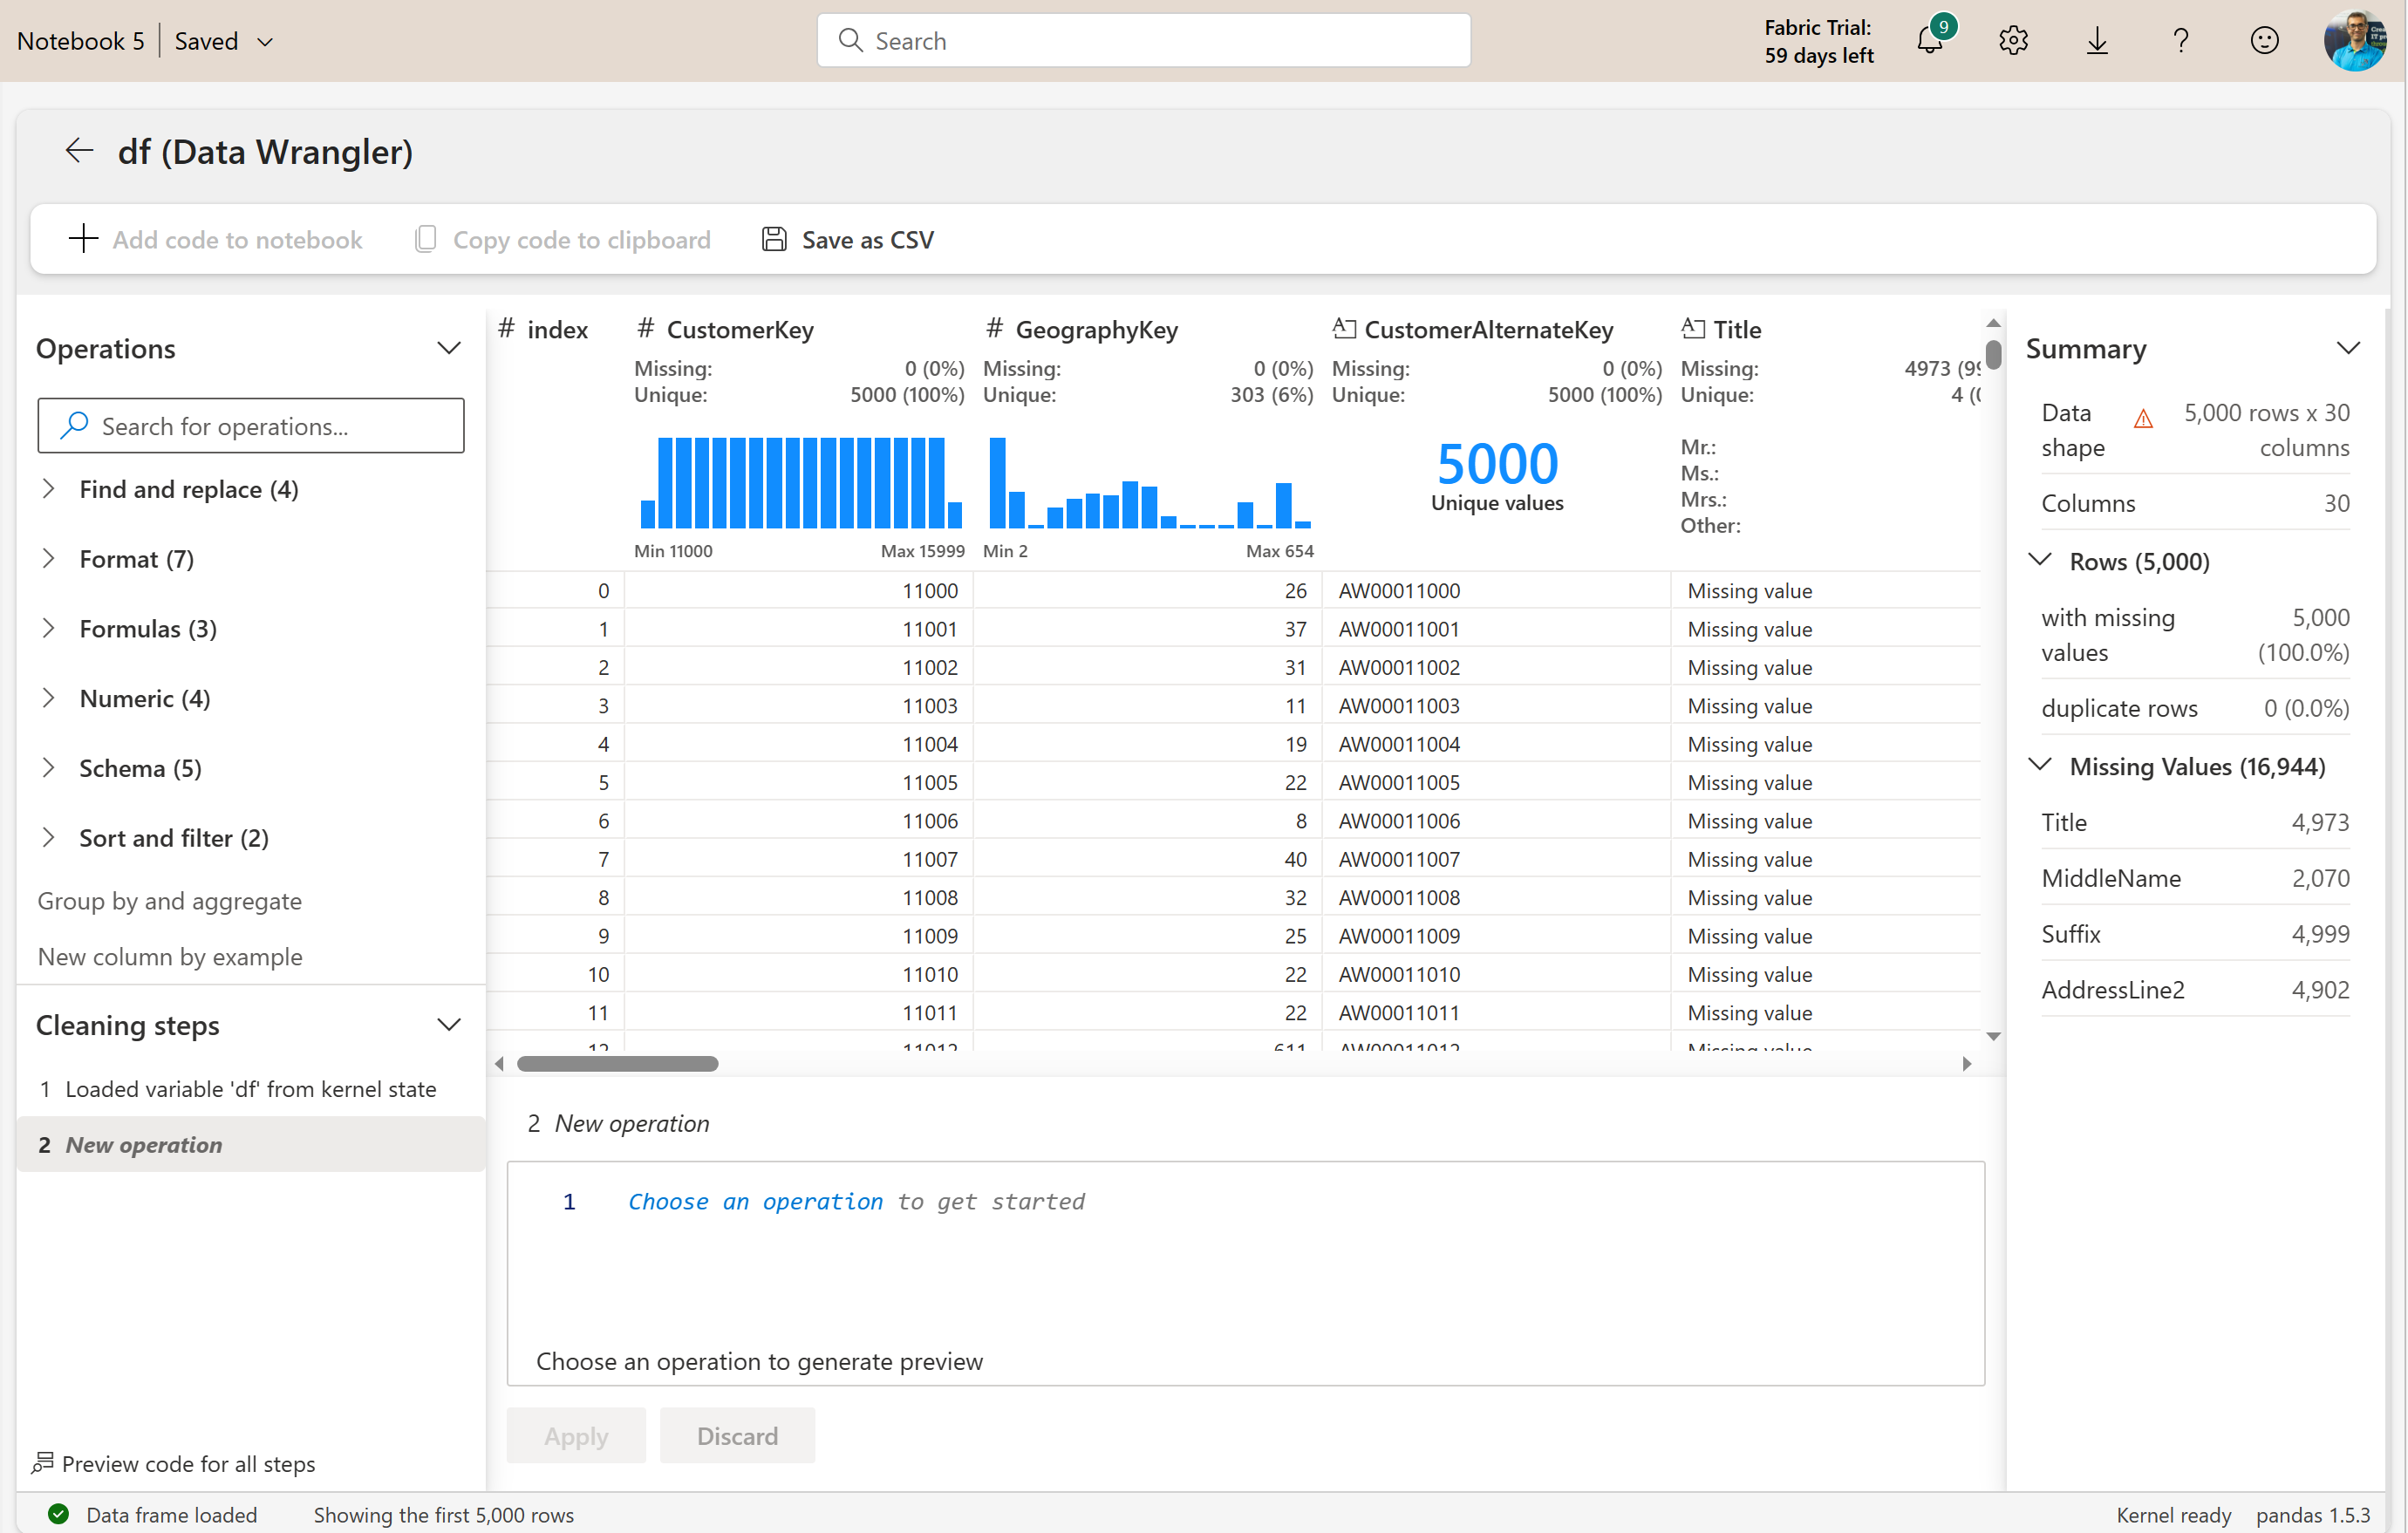
This will launch the Data Wrangler editor. This editor is an online editor. The editor can be best seen on large monitors.
The editor is a simple-to-use editor. This will be a familiar environment if you have some experience with Power Query Editor. There are different areas in the editor to help with the data preparation work as below;
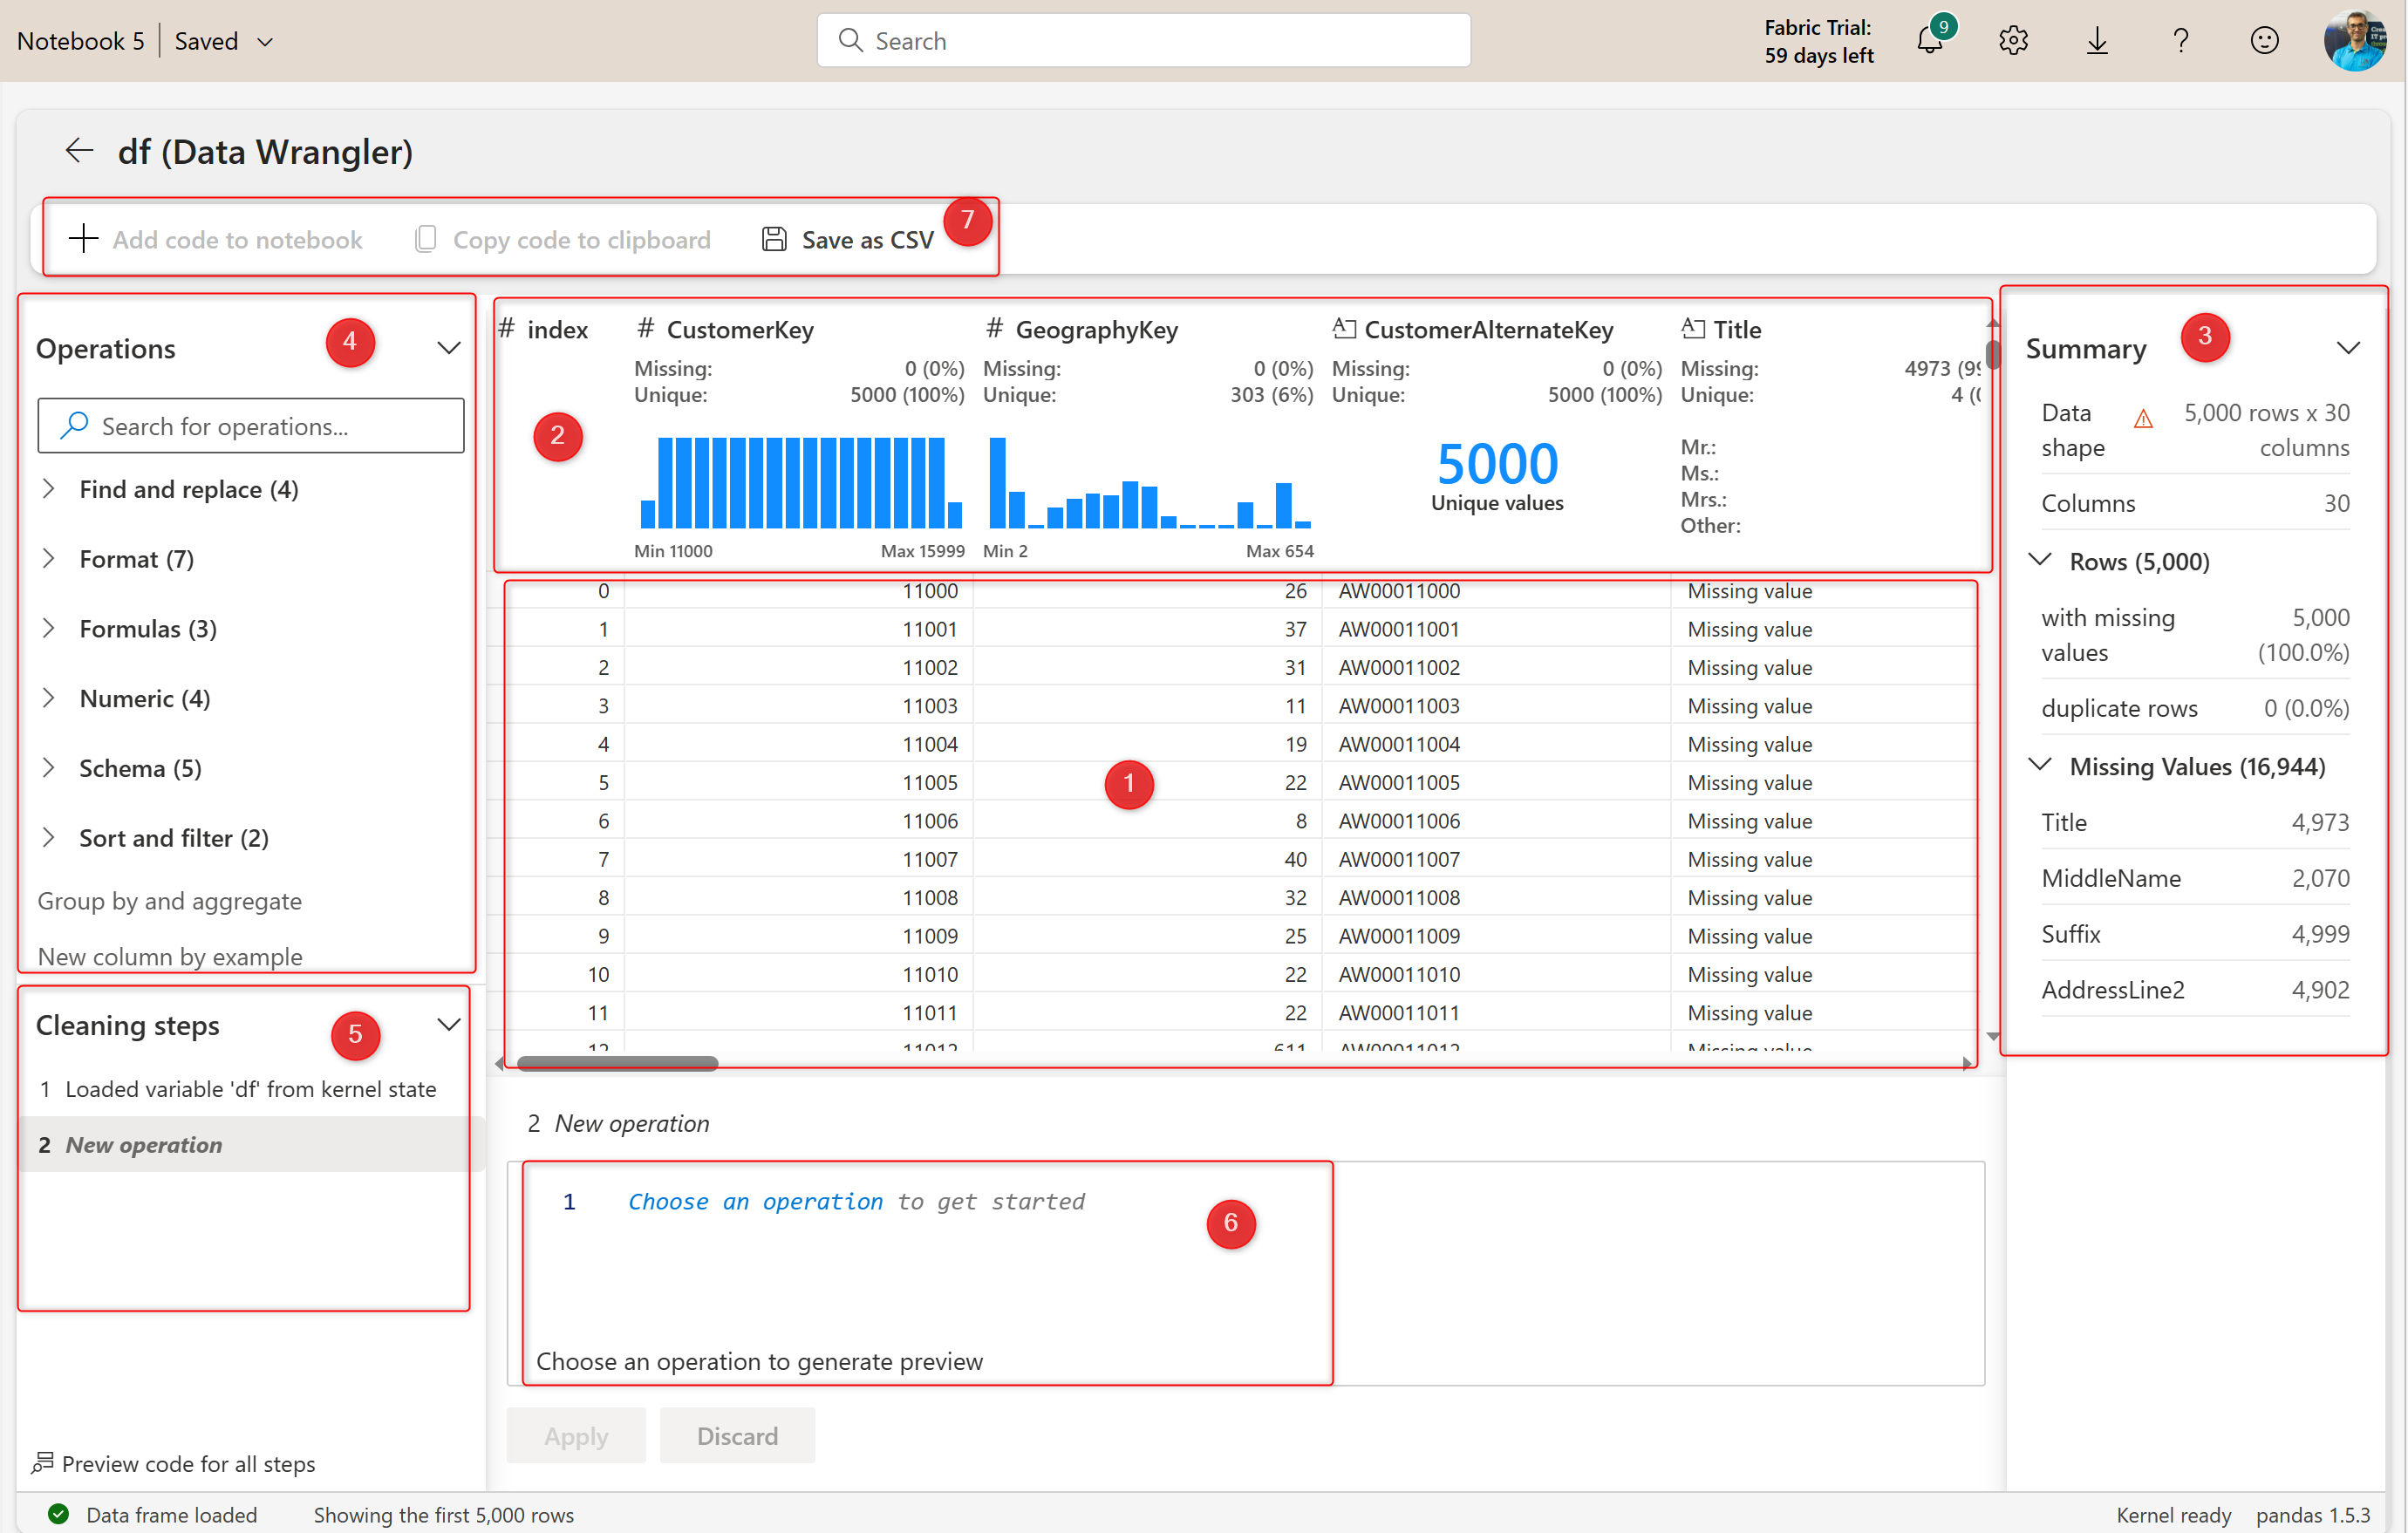
As indexed in the screenshot above, here are the components of Data Wrangler;
- The data preview. After applying any operation, you can see the preview here immediately.
- Summary of data quality and profiling information for each column.
- More detailed data quality and profiling for the selected column or table.
- Operations or data transformations.
- Cleaning steps or applied steps. These will be operations in the order you applied them to the data.
- The code for the selected step. The code will be in Python.
- Export the results or generate the code for the entire process.
Now let’s see these components in action.
Sample Transformations
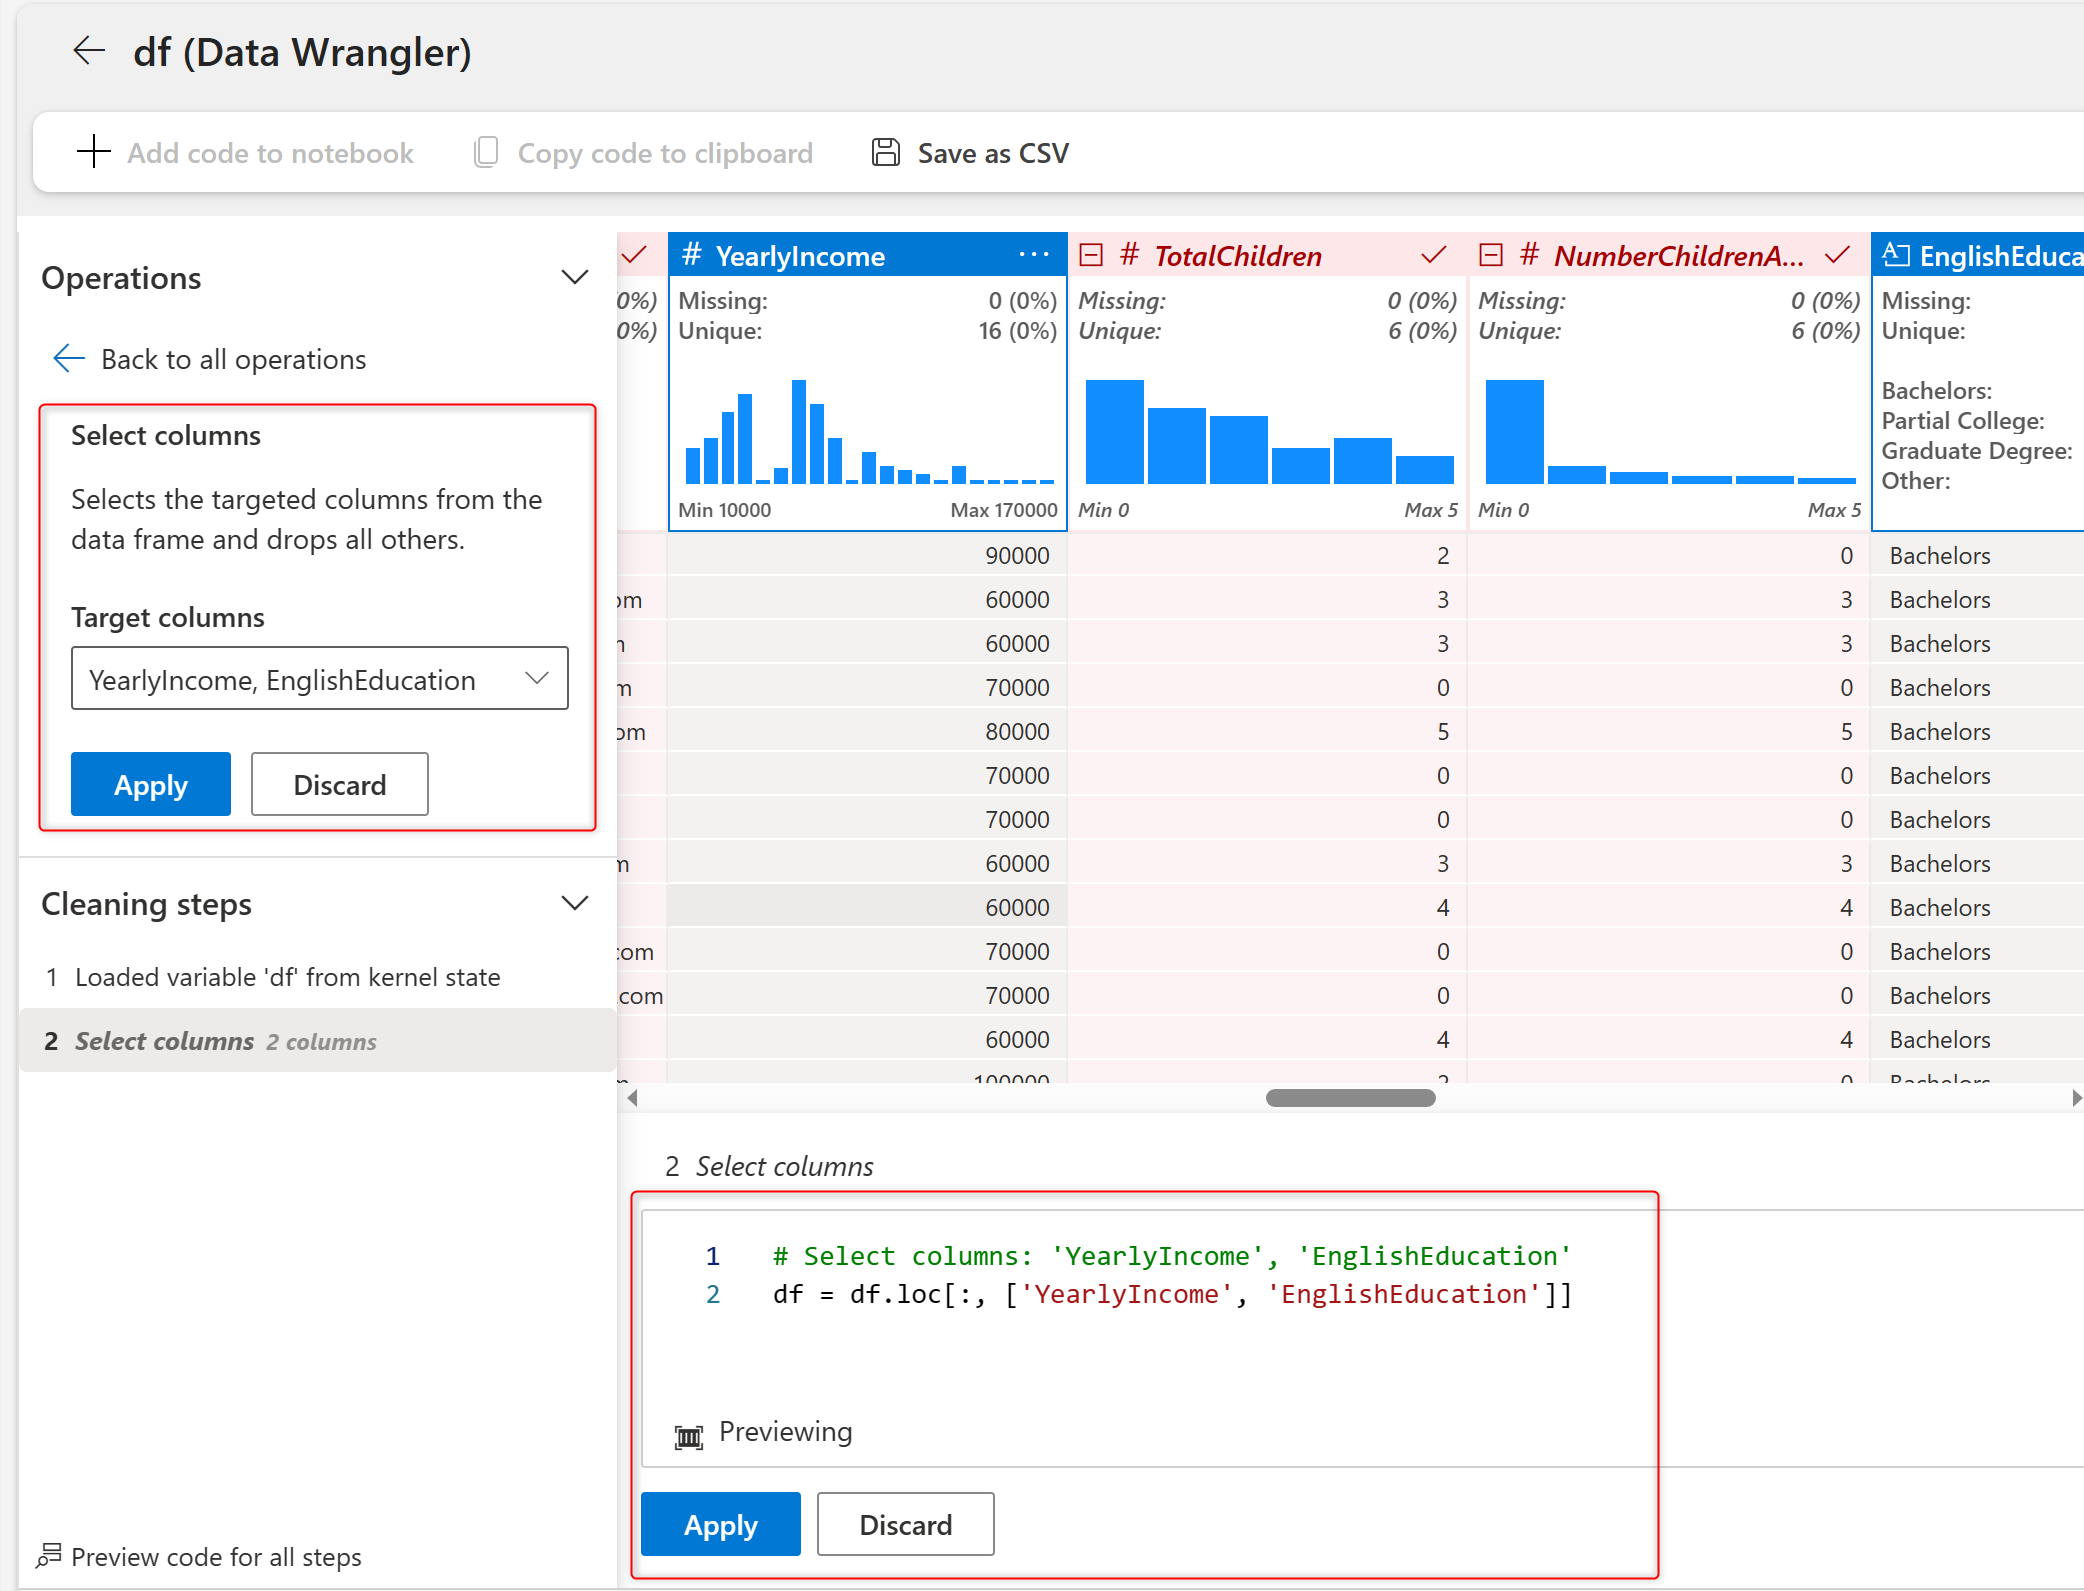
Select YearlyIncome and EnglishEduction columns by holding the Ctrl key on the keyboard, and then under Operations, Schema, click on Select Columns.
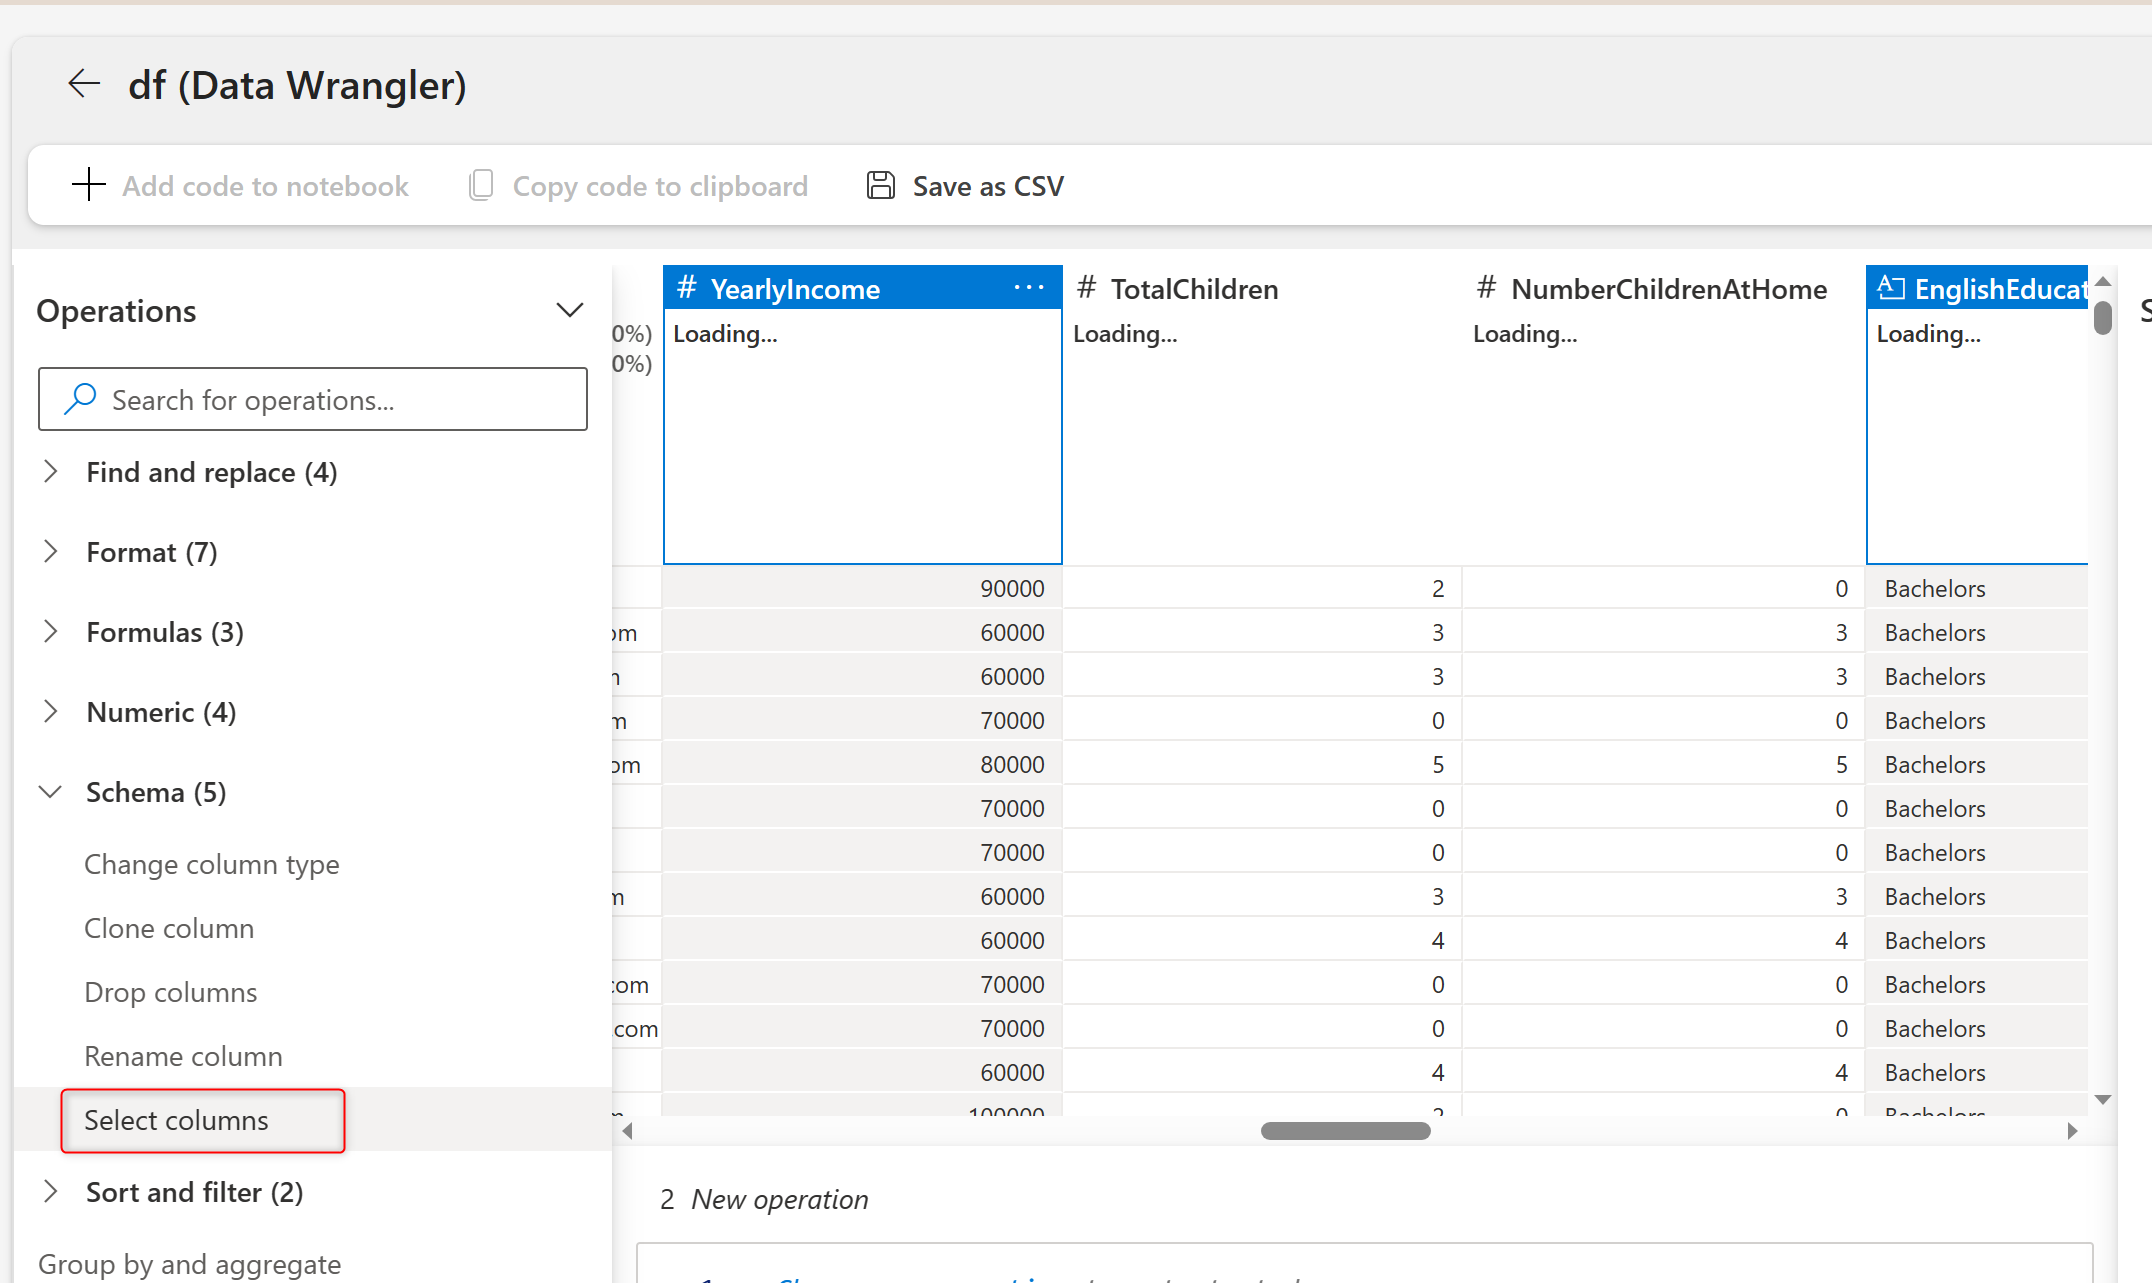
This will generate the code for selecting the two columns chosen, which you can click on Apply to proceed with the change.
Now, from the remaining columns, select EnglishEducation, and then click on Group by and Aggregate. Choose the YearlyIncome as the aggregate column and choose Mean as the function.
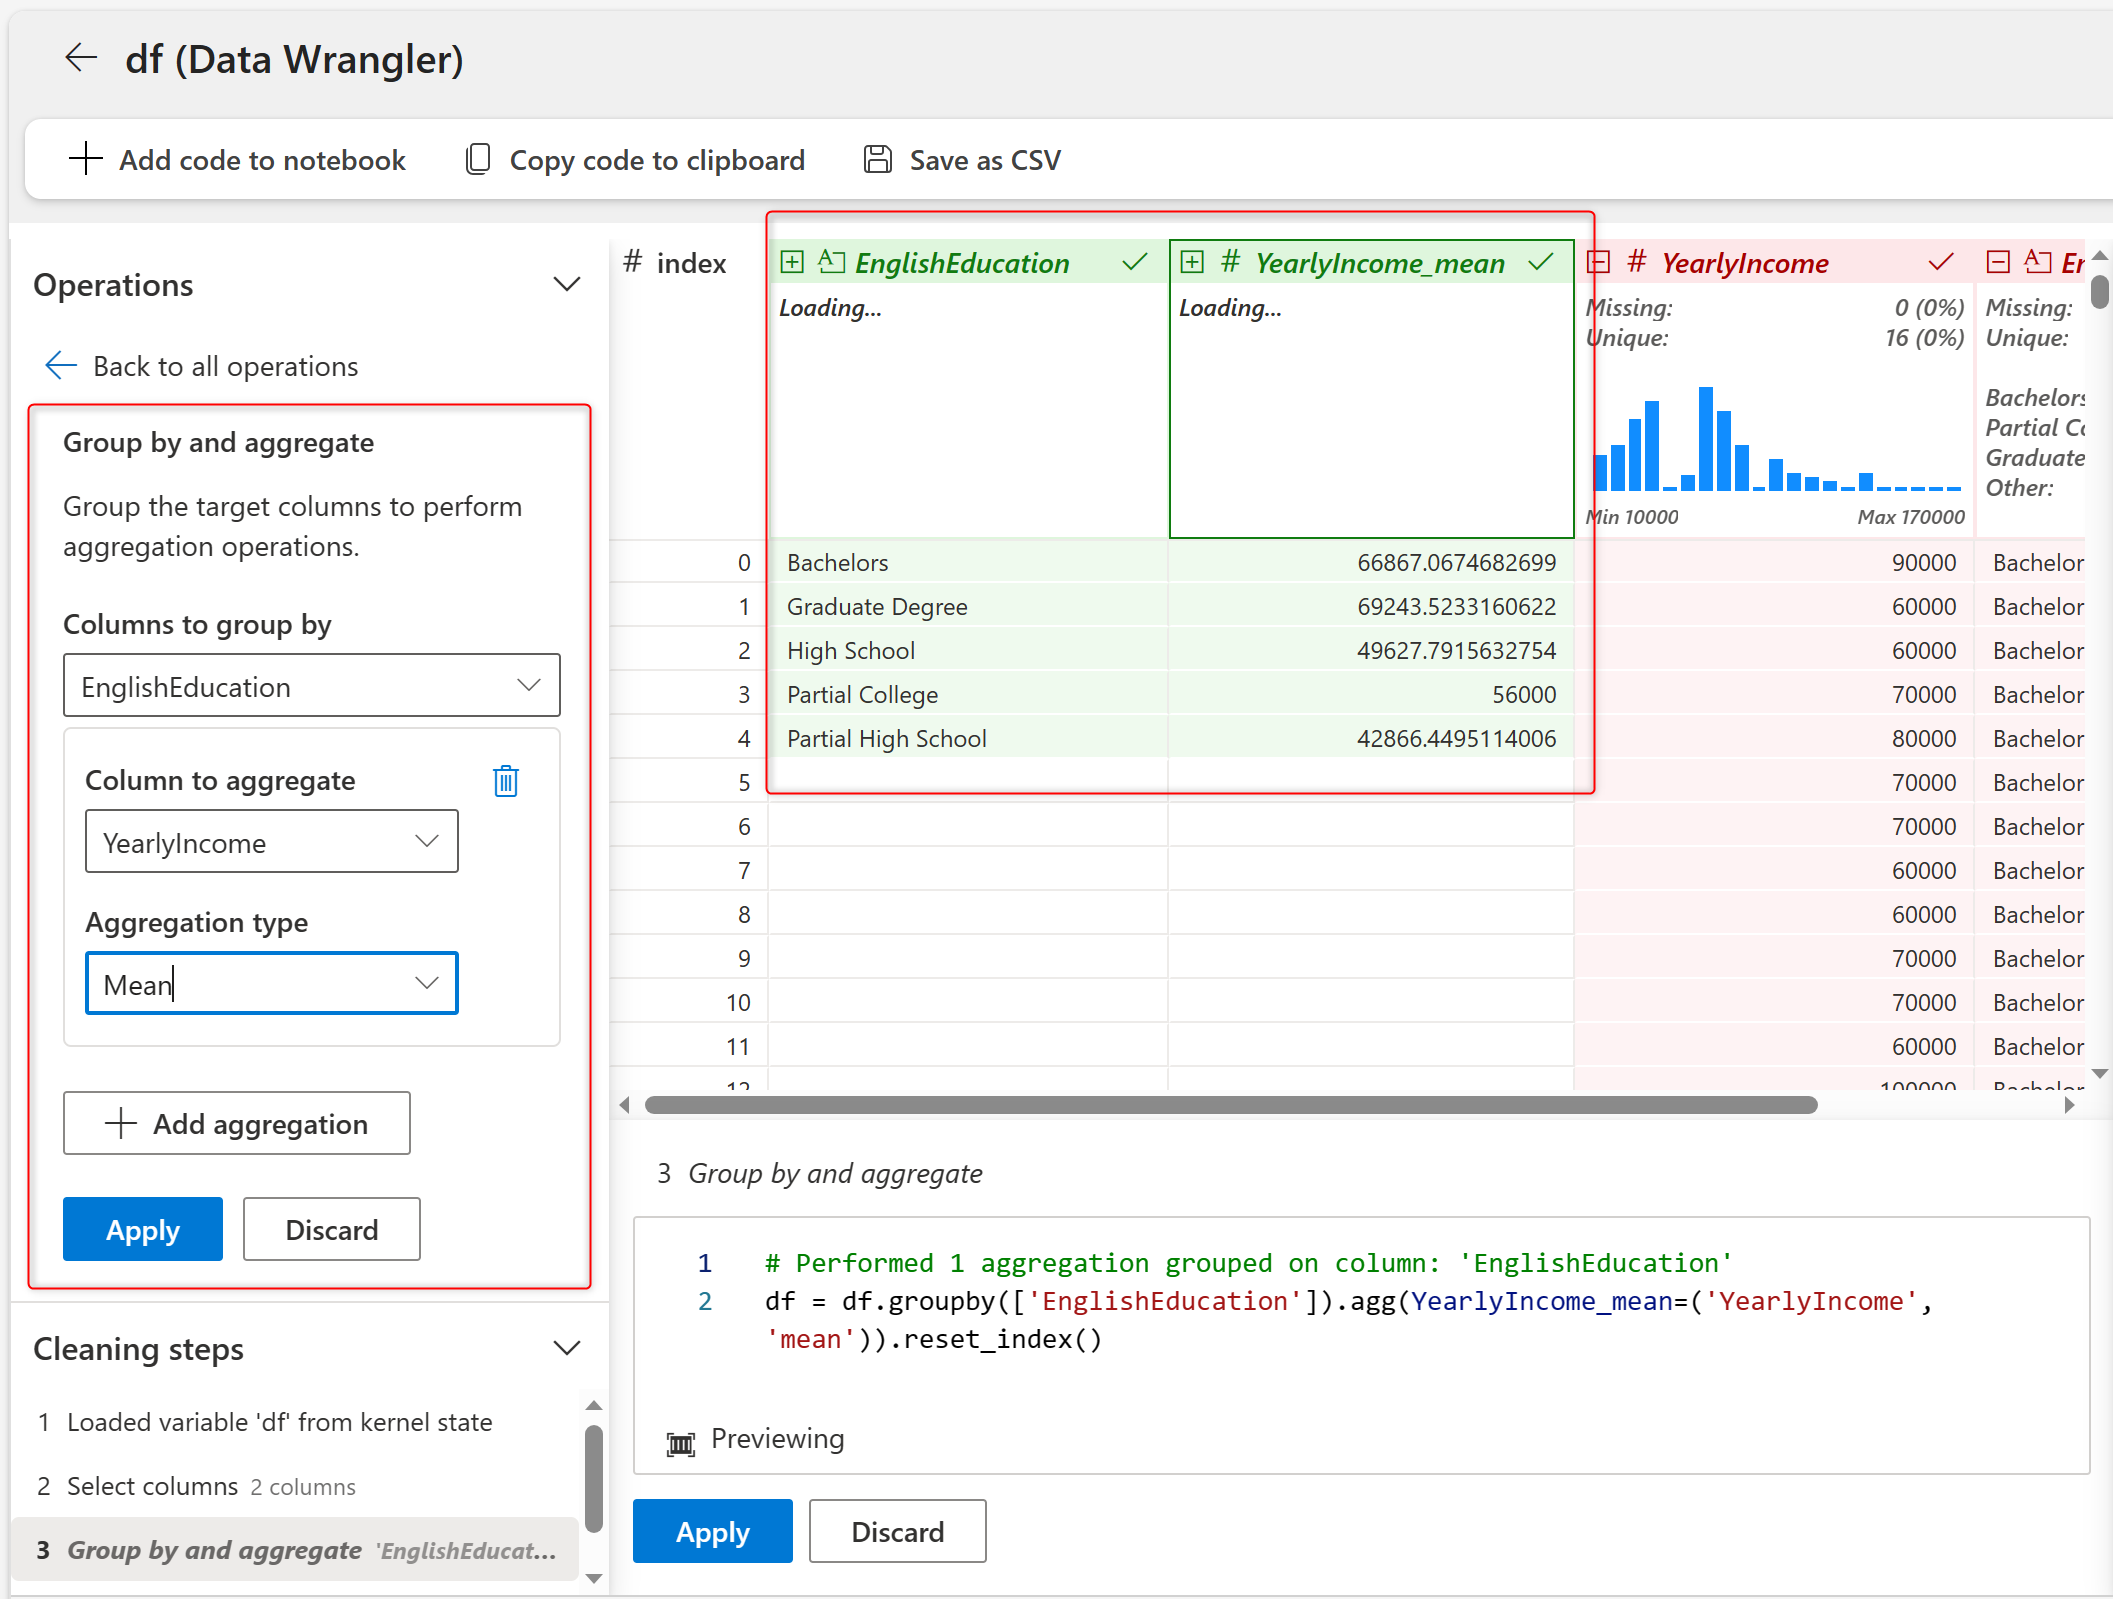
This will calculate the mean of each group very fast. After applying, you will have five Education categories, with the Mean of The YearlyIncome in each group.
As the last step, Sort the data Descending by the new column.
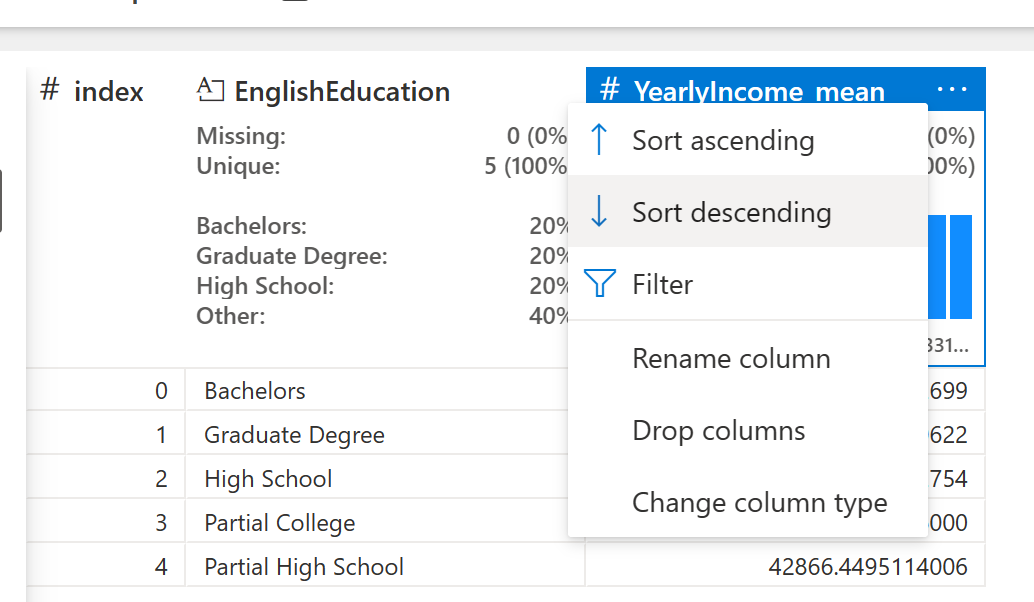
The Data Wrangler experience, as you can see, is easy-to-use. You can also change the parameters in the code if you want. After you prepare the data the way you want, you can now decide what to do with the result.
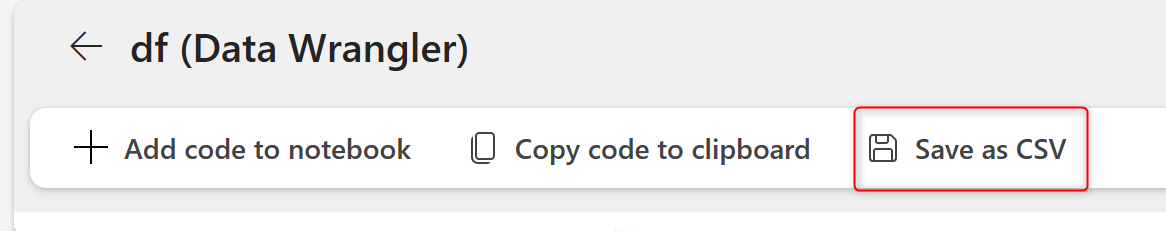
If this table is the desired result and nothing else, you can export it as CSV.
Generate Python Code
If you want to automate this process, for example, if you want this process to be part of an ETL process that runs when you load data into the Lakehouse, or you want to schedule it to run daily, then you can export the entire code for this process into a Notebook.
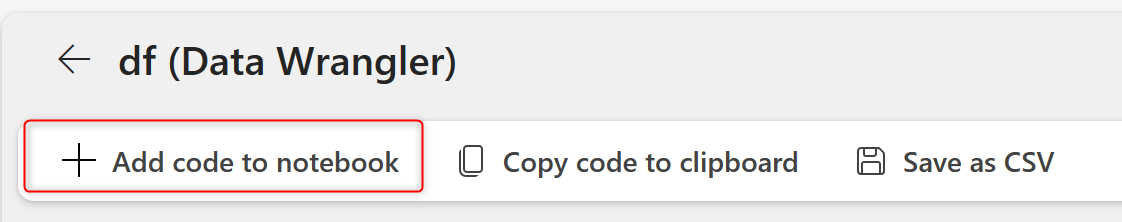
This adds the code to your existing Notebook, which you can run to check the outcome.
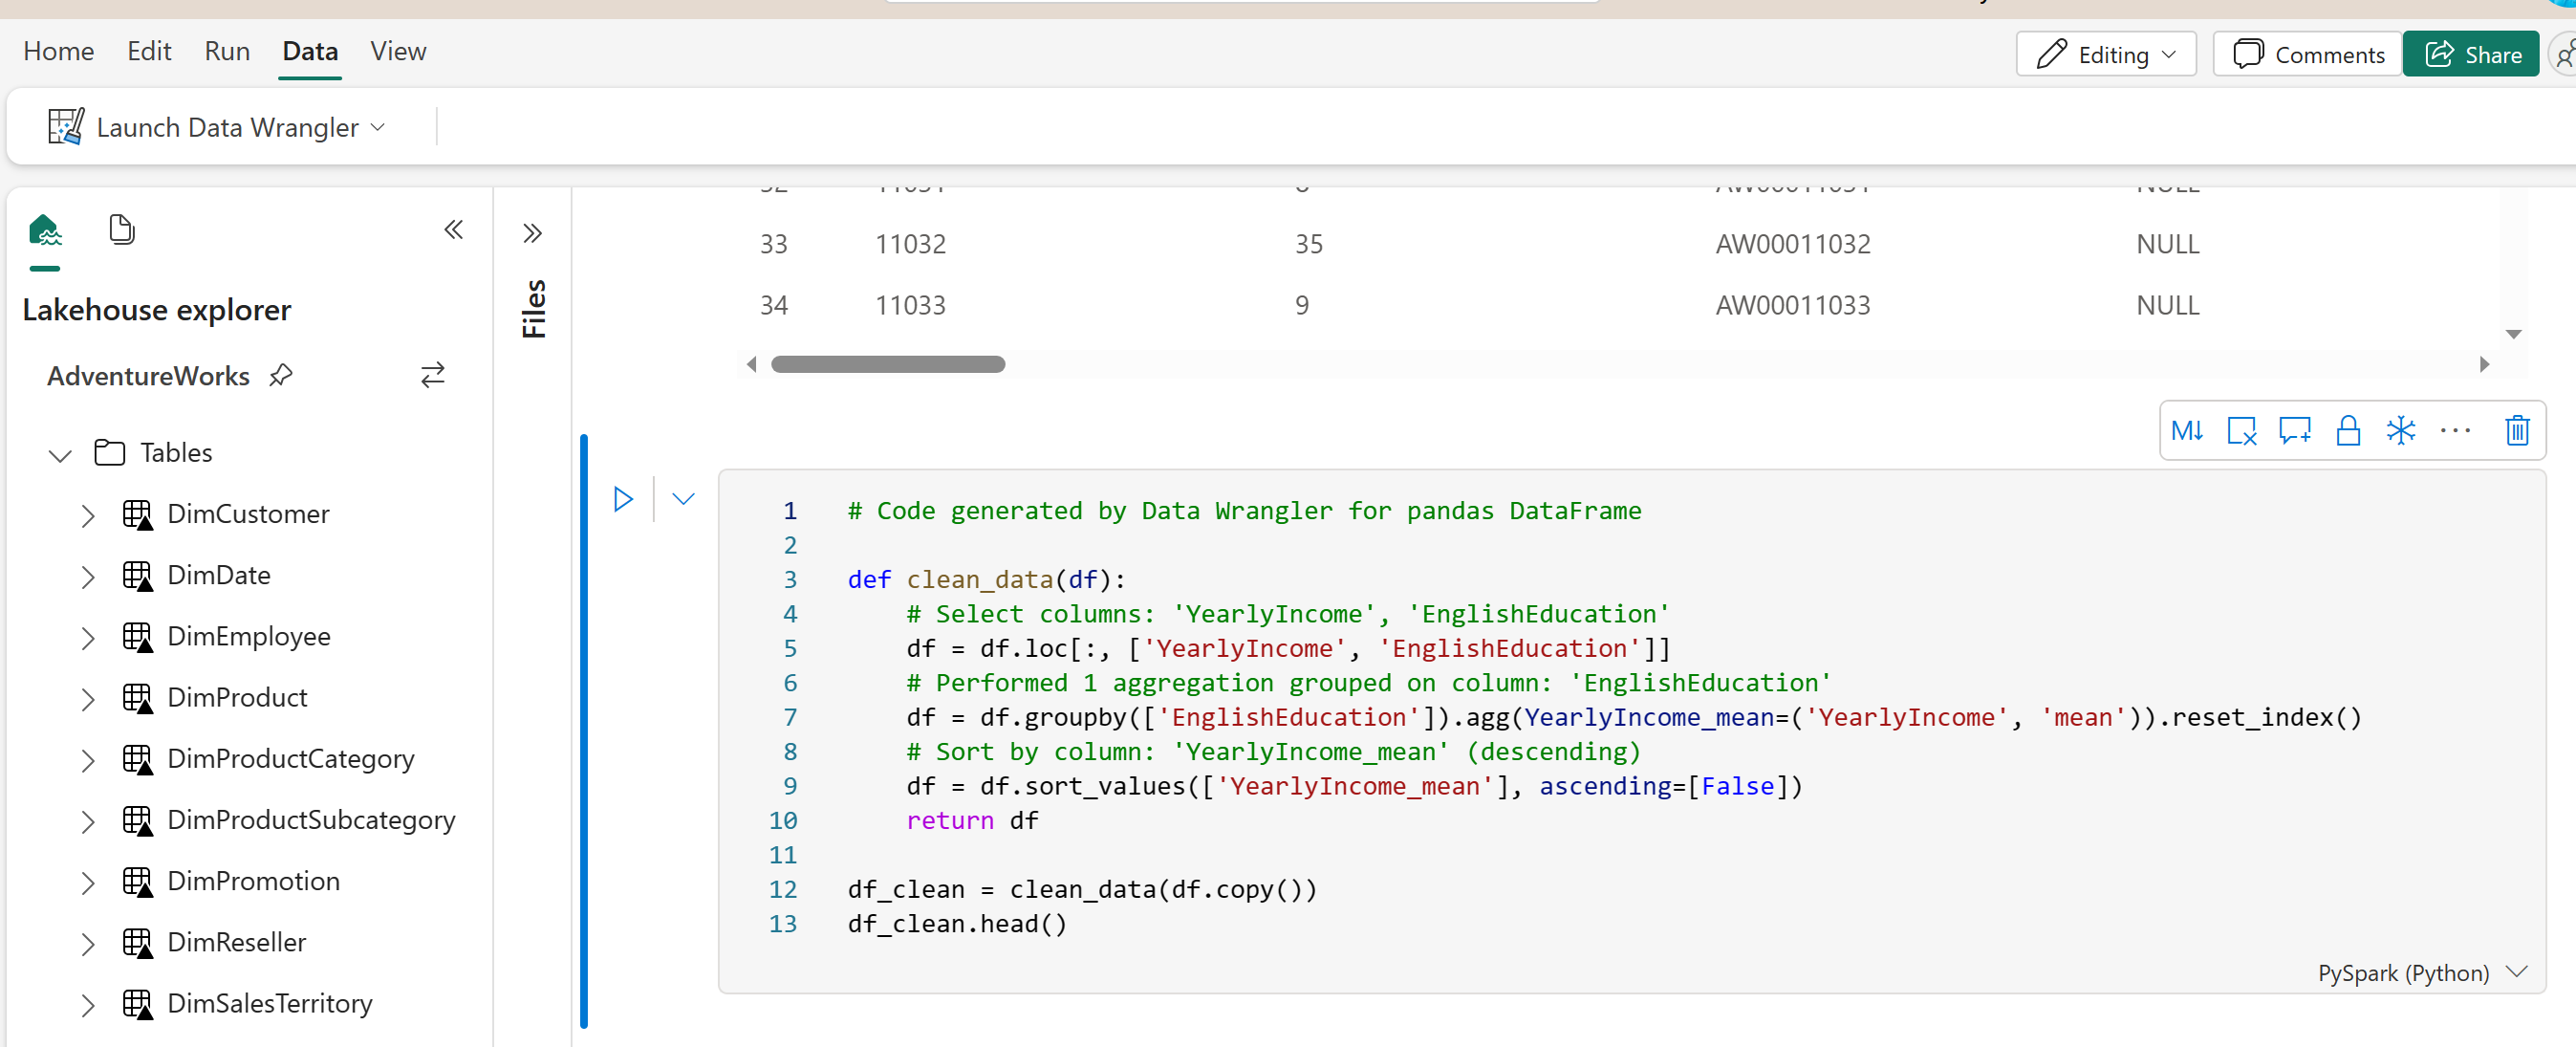
You can add a couple of lines to write the output back into the Lakehouse as a parquet file.
# Code generated by Data Wrangler for pandas DataFrame

def clean_data(df):
    # Select columns: 'YearlyIncome', 'EnglishEducation'
    df = df.loc[:, ['YearlyIncome', 'EnglishEducation']]
    # Performed 1 aggregation grouped on column: 'EnglishEducation'
    df = df.groupby(['EnglishEducation']).agg(YearlyIncome_mean=('YearlyIncome', 'mean')).reset_index()
    # Sort by column: 'YearlyIncome_mean' (descending)
    df = df.sort_values(['YearlyIncome_mean'], ascending=[False])
    return df

df_clean = clean_data(df.copy())
df_clean.head()
df_clean.to_parquet("abfss://FabricTest@onelake.dfs.fabric.microsoft.com/AdventureWorks.Lakehouse/Files/EductionGroups.parquet")
A code like the above can be scheduled using a Notebook directly or a Data Pipeline running a Notebook activity.
What about Power Query Editor?
If you have some experience with Power BI, you are perhaps familiar with Power Query. Power Query is the data transformation engine for Power BI, and it comes with a rich tool called Power Query Editor. Power Query Editor is a tool for citizen data analysts to prepare and transform data easily before loading the data into Power BI.
There are similarities between Power Query Editor and Data Wrangler. One might ask; will the Data Wrangler replace Power Query Editor? or is it better or worse than Power Query? What are the differences between these two tools, and which one should be used in which situation?
To correctly answer these questions, we would need an entire blog article, but for now, I will focus on some highlights here;
- Power Query Editor is not getting replaced by Data Wrangler
- The graphical interface of Power Query is much richer than Data Wrangler
- There are much more data transformations available in Power Query Editor
- Power Query Editor generates M script, while Data Wrangler generates Python code
- Depending on the outcome needed from the transformation, one tool might be chosen over the other.
- Data Wrangler is for data scientists, whereas the Power Query Editor is for citizen data analyst
- and some other differences
Although there are similarities between the two tools, there are differences too. Different data analytics scenarios might need to use one of these tools. Stay tuned for my other article about this topic in detail.
Summary: Data Wrangling for Scientists
Power Query Editor has been a powerful tool for many data analysts to perform data preparation and transformation. However, for data scientists, there is another option. Data Wrangler is an online editor for data cleaning and preparation, generating Python code. This tool is part of the Microsoft Fabric offering.
Data Wrangler might not be as rich in transformation power as the Power Query Editor. However, it helps in some data science operations much easier (an example is Mean and some other aggregation). Because this tool generates Python code, the outcome of it can be used in a Notebook and scheduled to run as a process.
Data Wrangler simplifies the process of writing Python code for data cleaning and data preparation. This ability makes Data Wrangler a helpful tool for data scientists. In this article, you learn about how it works through an example. I will explain the differences between Power Query Editor and Data Wrangler in another article.


Reza is author of more than 14 books on Microsoft Business Intelligence, most of these books are published under Power BI category. Among these are books such as Power BI DAX Simplified, Pro Power BI Architecture, Power BI from Rookie to Rock Star, Power Query books series, Row-Level Security in Power BI and etc.
He is an International Speaker in Microsoft Ignite, Microsoft Business Applications Summit, Data Insight Summit, PASS Summit, SQL Saturday and SQL user groups. And He is a Microsoft Certified Trainer.
Reza’s passion is to help you find the best data solution, he is Data enthusiast.
His articles on different aspects of technologies, especially on MS BI, can be found on his blog: https://radacad.com/blog.