

Power BI and Excel are longtime friends of each other, not only because Power BI components come from add-ins introduced in Excel but also because of how these two tools interact with each other from the Power BI Service. This post is not about using Power Query or Power Pivot components in Excel. This article and video discuss the interaction between Excel and Power BI through the service.
Power BI and Excel integration through the service allows the user to use Excel as their slicing and dicing tool while connected to a live Power BI dataset. On the other hand, you can pin a range of cells from an Excel document into the Power BI dashboard. Excel files also can be uploaded to the Workbook tab of the Power BI service. In this post, you will learn the below ways that Excel and Power BI interact with each other through Power BI Service;
- Analyze in Excel
- Publish to Power BI from Excel
- Import Excel into Power BI Desktop
Video
Analyze in Excel
Every company will find some users with very good experience and skillset in Excel. Excel users can still use Excel to connect to the Power BI dataset and use Excel features such as PivotTable and PivotChart to slice and dice the data. The connection to the Power BI dataset would be a live connection, which means whenever users refresh the Excel file, they will get the most up-to-date data from the Power BI service. Now let’s see how Analyze in Excel works in action.
Analyze in Excel from Power BI Service
You can initiate the Analyze in Excel from a Power BI Service report or a dataset. Log in to the Power BI service and click on the more options of a dataset (or a report). Click on the Analyze in Excel.
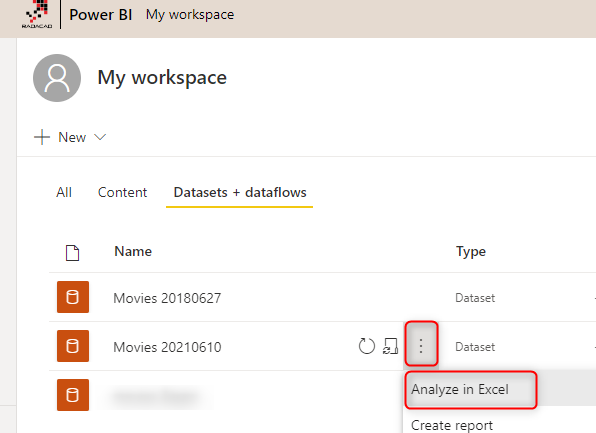
Power BI will generate an Excel file in OneDrive and create a connection from that Excel file to the Power BI dataset. You will get a notification when the Excel file is ready. (If you don’t have OneDrive for Business in your tenant, then clicking on Analyze in Excel will download the workbook to your local computer)
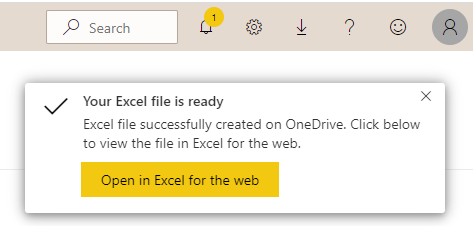
The opening of this file, by default, is in Excel online (web version). However, you can download the file and store it locally. Once you open the file, you will get a warning about the data coming from outside of this workbook (Power BI Dataset)
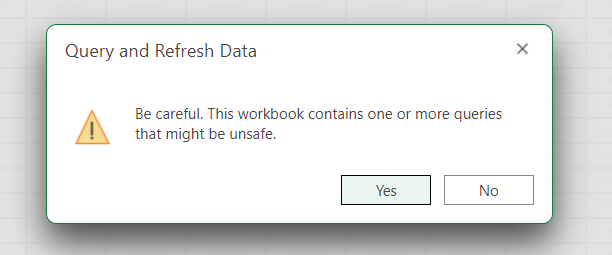
Once you click Yes, you will see an Excel workbook with a PivotTable, which is the data sourced from the Power BI dataset in the service. Analyze in Excel will use the same Power BI account username and password that you had access to the report from it (because the Power BI account is an Office 365 account).

Drag data fields into the slicing and dicing area (right under the fields pane), and you will see a result in PivotTable. This result is fetched live from the Power BI dataset in the Power BI service.

Implicit Measures won’t work in Excel.
Implicit measures are a measure that Power BI creates automatically. Power BI automatically applies auto summarization on numeric fields (that haven’t been part of a relationship). Behind the scenes, Power BI creates a measure for those fields; these measures are called Implicit measures. These are a measure that you can see a small Sum or Sigma icon beside their name in the Power BI Desktop.
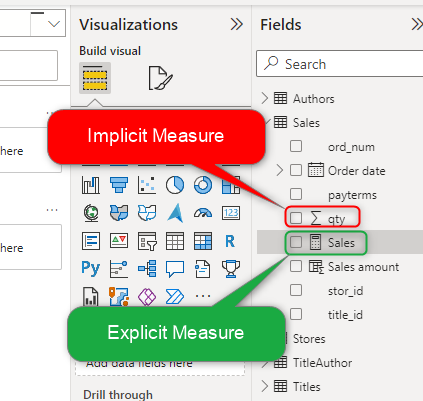
The implicit measure cannot be used in the Analyze in Excel feature; if you try dragging them in PivotTable, you will see individual values instead of the aggregation or measure result.

However, if you create explicit measures (which are DAX measures created by you), similar to the screenshot below;

Then you can use them in PivotTable as a normal measure and see the correct result.

If you consider some users to use Excel as their front-end tool to connect to Power BI Models, You have to consider creating the Explicit measure.
Excel is Connected Live to the Power BI Model in the Service
The wonderful thing about the Excel connection to the Power BI Service is that the connection is Live. Live connection means Excel fetches the data directly from the dataset in the Power BI service. Anytime you refresh the Excel file, you get the most up-to-date data from the service. This feature is completely different from Export to Excel. The export to Excel option you see on visuals in the Power BI service only downloads data offline. However, Analyze in Excel is an online and live connection to the dataset.
You can check the connection properties in the Data tab, under the Connections, Properties section.

The Connection properties will have an Azure address in it with the ID of the dataset in the Power BI service. You can even use this connection in any other excel file to connect to the same dataset.

Get Data from Power BI Dataset
Another very similar approach to Analyzing in Excel is getting data from the Power BI dataset in Excel. If you have an Excel file and you want to do some data analysis on the data of a Power BI dataset, you can go to the Data tab, under getting Data, Under Power Platform, Choose Dataset.
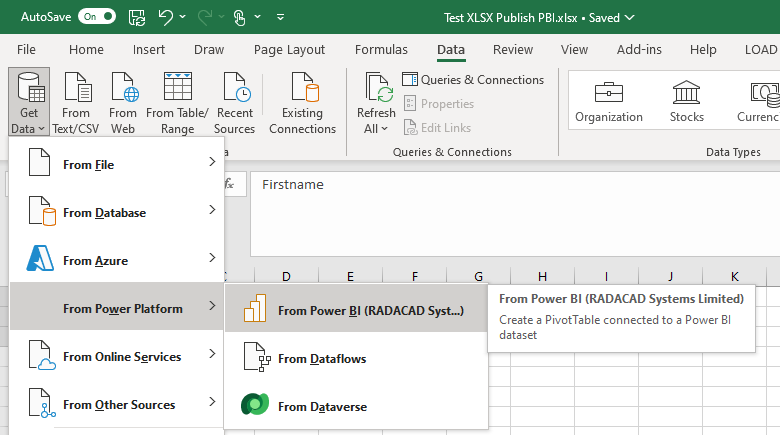
This will show you the list of Power BI datasets that you have access to, and you can select to get data from any of those.
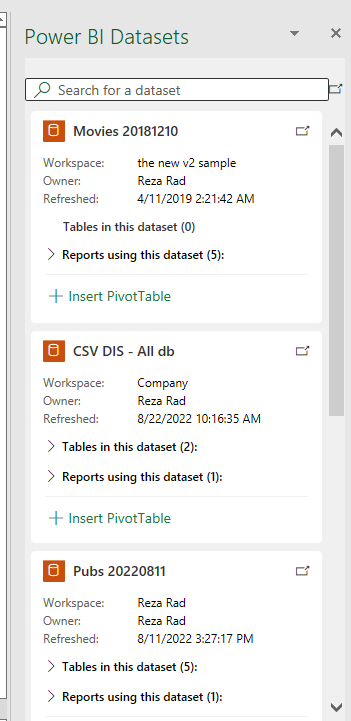
This will create a live connection to the Power BI dataset (Similar to a thin report).
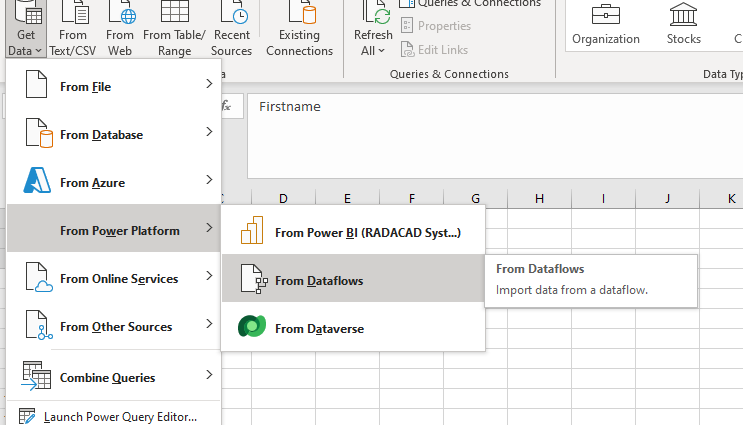
Get Data from Power BI Dataflow
Using Excel, you can also connect to a Power Platform Dataflow and get data from it.
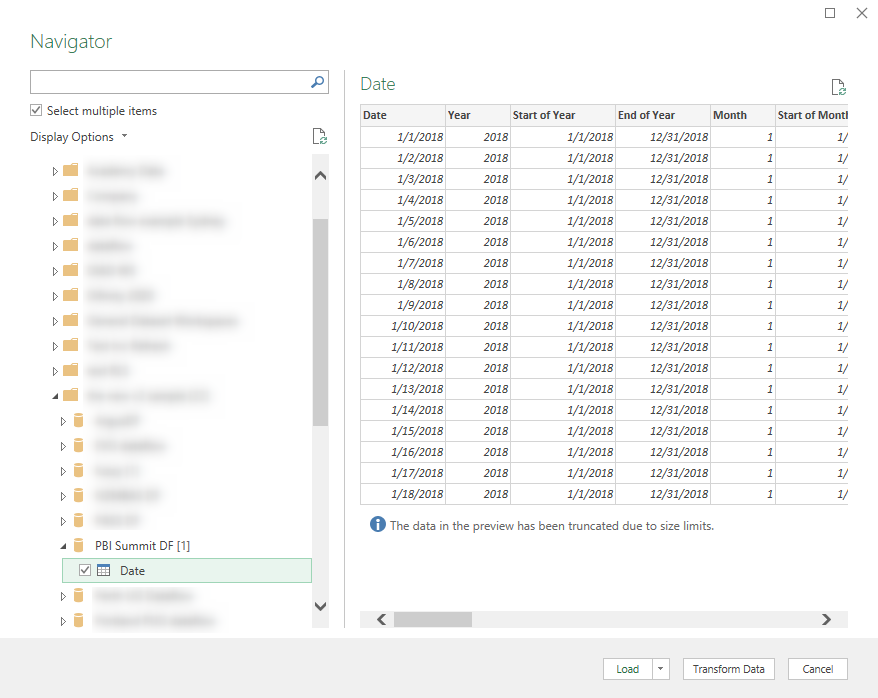
The Navigator window will show you both Power Platform dataflows (under Environments) and Power BI dataflow (under workspaces);
Why Analyze in Excel is Better than Export Data?
There are many reasons why Analyzing in Excel is a better option than exporting data. Let’s explore some of those here.
Analyze in Excel is Live Connection, Export Data is Offline, outdated
As soon as you export data from a Power BI report or dataset, you create a snapshot of the data then. If the report refreshes the next day, your exported data is no longer up-to-date. It is offline and outdated.
However, when you use Analyze in Excel. Excel’s data is fetched live from the Power BI dataset in the service. You can see that in the connection properties of Exel. You can check the connection properties in the Data tab, under the Connections, Properties section. The Connection properties will have an Azure address in it with the ID of the dataset in the Power BI service. You can even use this connection in any other excel file to connect to the same dataset.
Export Data is limited to 150,000 Rows; analyze in Excel Not!
Export data has a limitation on the number of rows. Analyze in Excel doesn’t. You are connected to the model live. It looks like a live connection to SSAS tabular; you can do whatever you want with the data.
The export is limited to 150K rows if you export to Excel and 30K rows for CSV files.
Export Data is limited to specific visuals and fields used in that visual
When you use Export Data, you only do it from a specific visual. And fields in that visual (or related fields to that) are exported.
When you use analyze in Excel, you will have access to all the tables, columns, and their calculated fields and measures in Excel:
Analyze in Excel is the Entire model: all tables and calculations
Export Data is not Secure. Analyze in Excel uses Power BI account credentials.
You might export data using an account that has access to everything. And then share the exported data file with someone who should NOT have access to the data. Because the security and the data are decoupled when you use the export data, then there is no security around it. You have to be careful to secure the exported data yourself.
However, when you use Analyze in Excel, You have to log in with your Power BI account and see the data only if you have access to it.
Analyze in Excel supports Row-Level Security.
Because users log in from Excel, when they use the Analyze in Excel feature will see only part of the data they are allowed to see. That means if there is row-level security enabled on the data. Users will see only their part of the data, nothing more. (as long as they don’t have Edit access on the dataset)
Analyze in Excel uses the concept of Shared Datasets
When you use the Analyze in Excel feature, you use the shared Power BI dataset from the Excel front end. Whenever the dataset refreshes, you have the new data. You will get the updates if the dataset gets a new table or field.

As the above screenshot shows, the Analyze in Excel works well with multi-layered architecture for Power BI development. The visualization layer can be Power BI reports, paginated reports, or even Excel.
Publish to Power BI from Excel
Not only can Excel read data from the Power BI Service, but also it can publish data into Power BI. This is possible in Excel 2016 editions or Office 365 editions of Excel. Once you click the Publish button on the File menu, you will see an option to Publish into Power BI.
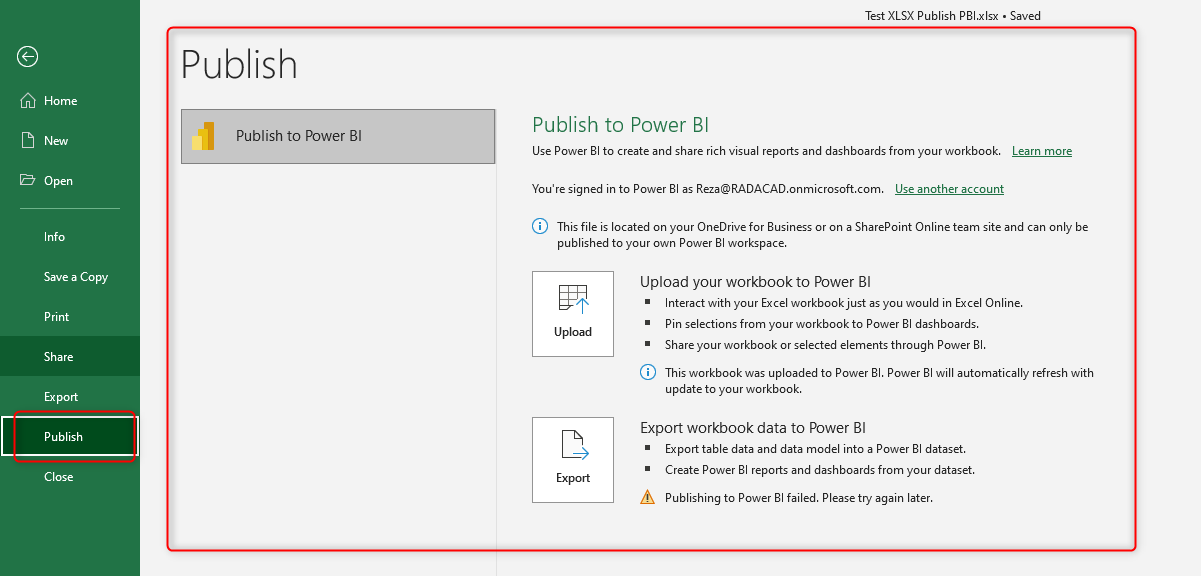
Upload your workbook to Power BI
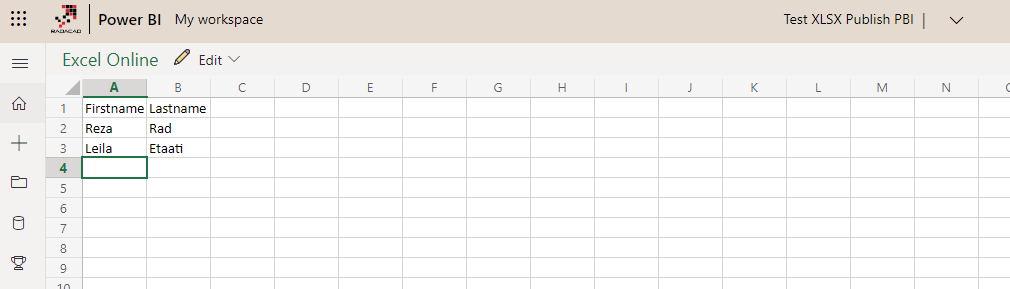
If you have an Excel workbook file, which you want to keep beside your Power BI objects (reports, dashboards, and datasets), then this option is for you. You can upload the workbook into the Power BI workspace using this option. Once the process is completed, The excel workbook will be accessible from the Power BI workspace and can be opened and edited in Excel online.
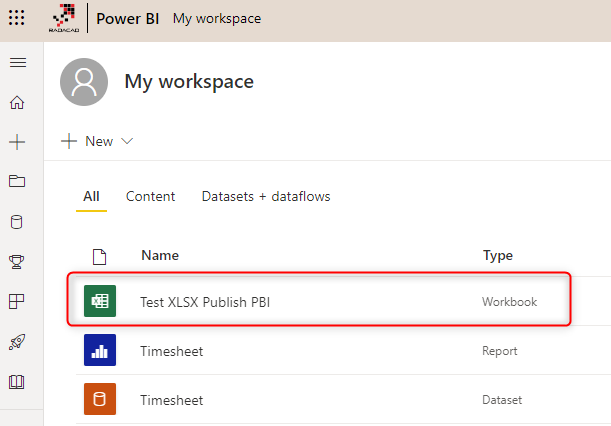
The Excel workbook, as mentioned, can be edited or viewed online.
Export workbook data to Power BI
Here comes the exciting feature; not only can you upload the excel file as a workbook, but also, you can export it as a Power BI dataset. To do this, you must have data in the Excel file as tables. The tables’ data will then be exported into a Power BI dataset from Excel (and it can be updated by updating the Excel file).
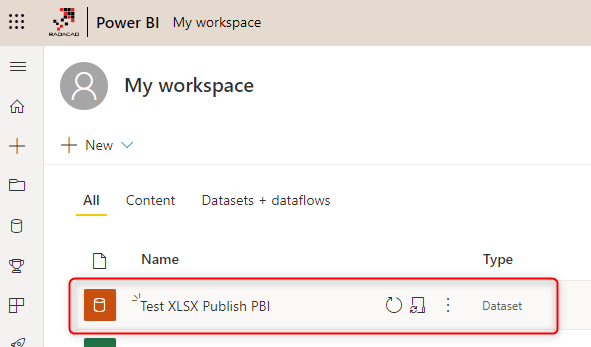
After these publish options, you will see a short message showing the publish process to the Power BI service;
These two options might not be very commonly used, but they certainly will bring an interesting aspect of integration between Excel and Power BI.
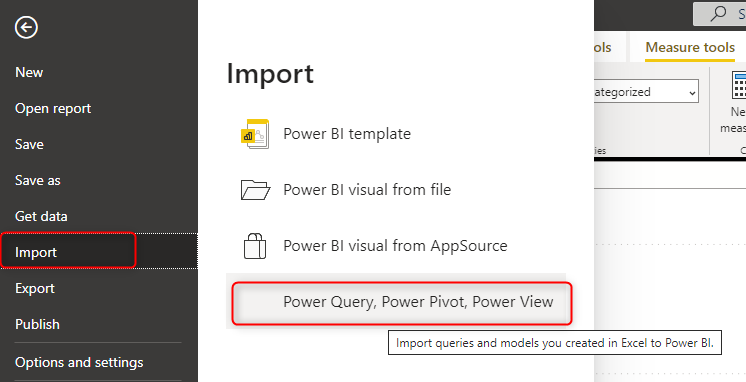
Import Excel into Power BI Desktop
We cannot discuss all Excel and Power BI integration options without mentioning the most important developer option. You can import an Excel model which includes a Power Pivot model into Power BI. The Import into Power BI doesn’t mean Get Data from Excel, it means the entire model, including all the tables, relationships, and calculations, will be imported into a Power BI report. The scenario above is a very handy option when you have an existing Power Pivot model in Excel.
Importing an Excel workbook has a very easy and straightforward process. The only important note in this process is that your Excel file should not be password protected.
Summary
In this article, you’ve learned methods by that Excel, and Power BI work together. Each of the modes of integration will give you some features. Analyzing in Excel will allow you to slice and dice the data model of the Power BI service easily from Excel through PivotTable and PivotChart. Excel can publish the entire workbook or the data part as a dataset into Power BI. Both of the features mentioned above will be highly well received by your business users who are good with Excel as a front-end tool. Last but not least, you can import an entire Excel Power Pivot model with all tables, relationships, and calculations into a Power BI report instead of re-creating it.


Reza is author of more than 14 books on Microsoft Business Intelligence, most of these books are published under Power BI category. Among these are books such as Power BI DAX Simplified, Pro Power BI Architecture, Power BI from Rookie to Rock Star, Power Query books series, Row-Level Security in Power BI and etc.
He is an International Speaker in Microsoft Ignite, Microsoft Business Applications Summit, Data Insight Summit, PASS Summit, SQL Saturday and SQL user groups. And He is a Microsoft Certified Trainer.
Reza’s passion is to help you find the best data solution, he is Data enthusiast.
His articles on different aspects of technologies, especially on MS BI, can be found on his blog: https://radacad.com/blog.
Great article. Are any of these features available for the Power BI on-premise report server or are they exclusive to the cloud service only?
Hi Jeff.
These features at the moment is for service only.
in Power BI report server; the approach is that if you want to use the integration; then you can use SSAS live connection, and you will be able to use Excel to connect to it.
Cheers
Reza
Excellent article. One use I can see of pinning screenshots into dashboards could be to add comments. Just a thought, I haven’t actually tried it out yet. Interested in knowing your thoughts.
Does “Analyze in Excel from Power BI Service” also work with Excel an a Mac?
Good question Alex
I don’t have access to a Mac machine to test. Any of readers here can comment?
Cheers
Reza
Is there a way to rapidly create measure so that PowerBI and Excel can communicate properly. I find it frustrating that this Microsoft solution does not allow Excel to recognize Implicit measure in Excel. After adding explicit measures to my data model, I’m left with duplication and quite frankly, a mess. There must be a better way.
unfortunately not. But when the XMLA endpoint becomes available for Power BI, then tools like Power BI Helper would be able to interact with the model and possibly create measures dynamically.
Cheers
Reza
Hi! Is there a way to use “Analyze in Excel” with a Table (Excel flat table) connected to the PBI, instead of a pivot table?
Hi Marnique
What do you want to do with a flat table? I believe you can do whatever you want with PivotTable and build it in flay layout
Cheers
Reza
Reza,
can we extract Initial Catalog (this part in odc string) from the web to change Propeties in excel in manual way?
What do you mean by “Extract”? do you mean creating a back up of that data model of Power BI locally?
Hi –
Thanks for the overview of Excel / Power BI integration options. I’ve found your blog to be a great reference as we roll out Power BI in our org!
We have a few users that defer to the Analyze in Excel option. We seem to be having a sporadic issue, however, in that one particular dimension field will hang up when added to a pivot table filter and expanded in the drop down (much like a slicer would behave in the service). This happens maybe 5% of the time and is usually fixed with a dataset refresh. Further, the issue seems to be limited to Excel and not the Power BI service. Excel will show “Running OLAP query…” in the bottom right when this is happening, and pressing ESC will cancel the operation. The dataset is fairly small and narrow and this field only has about a half dozen distinct values (so it’s not producing a list of thousands or millions in the drop down). I’m wondering if you know of ways to troubleshoot this (capture the OLAP query trying to execute?) and/or whether you’ve experienced something like this before and what the fix might be?
Apologies for the support question… I’ve just had a tough time finding much info on this issue. Appreciate any insight!
Hi Eric
Is it possible that you can send me the file to investigate? for small data, it shouldn’t be slow
Cheers
Reza
Hi Reza,
I could email the file, but I’m not sure what good that will do since it requires connection to the dataset and not something available outside of our tenant. I also can’t seem to find your email address on the site. If possible, would you mind sending me an email and we can discuss options from there?
I appreciate the assistance!
-Eric
please use the Contact us form, and we will send you an email
Cheers
Reza
Thanks for this great article.
I would have one question, in section “Excel is Connected Live to the Power BI Model in the Service” you mentioned that there is live connection between Excel and Analysis Service model of PBI Service.
Do you know (and can give me a hint how) how to connect to this AS model via Power BI Desktop, with Import mode, and defining this connection manualy ?
Hi
This type of connection is at the moment only supported through XMLA connectivity, which is supported for Premium.
Cheers
Reza