
These two functions in DAX are often used instead of each other; ALL and ALLSELECTED. Their behavior can be similar in some contexts, but it can also be different in other contexts. In this article and video, I’ll explain the difference between these two functions and when to use each in DAX for Power BI, Analysis Services, or Power Pivot.

Video
ALL
I have explained in another article about the ALL function in DAX. It is a very useful function that is in the category of tabular functions, and its main function is to ignore the filters coming from other fields. An example of using ALL is to calculate the percentage of the total in a visual.

To learn more about the ALL function, read my articles below;
- How to Use ALL in a DAX Expression in Power BI
- Now You See Me! Use cases of ALL DAX Function in Power BI
ALLSELECTED
The ALLSELECTED is also a tabular function that performs very much similarly to the ALL. with one big difference; ALLSELECTED only ignores the filters coming from inside the visual itself, whereas ALL ignores any filters coming from anywhere in this visual or other visual on the page.
This might be confusing to understand, which is why I explain it in an example below.
Learn through example
I have an example dataset with three measures below;
The first measure has no filter applied, so it simply calculates the sum of Sales.
Sales - No ALL =
CALCULATE(
    SUM(FactInternetSales[SalesAmount])
)
The second measure calculates the sum of Sales but with an ALL filter applied to the FactInternetSales table.
Sales - with ALL = CALCULATE(
    SUM(FactInternetSales[SalesAmount]),
    ALL(FactInternetSales)
)
The third measure calculates the sum of Sales with the ALLSELECTED filter applied to FactInternetSales.
Sales - with AllSelected =
CALCULATE(
    SUM(FactInternetSales[SalesAmount]),
    ALLSELECTED(FactInternetSales)
)
The model diagram looks like the one below with one fact table (FactInternetSales) and three dimensions forming a star schema;
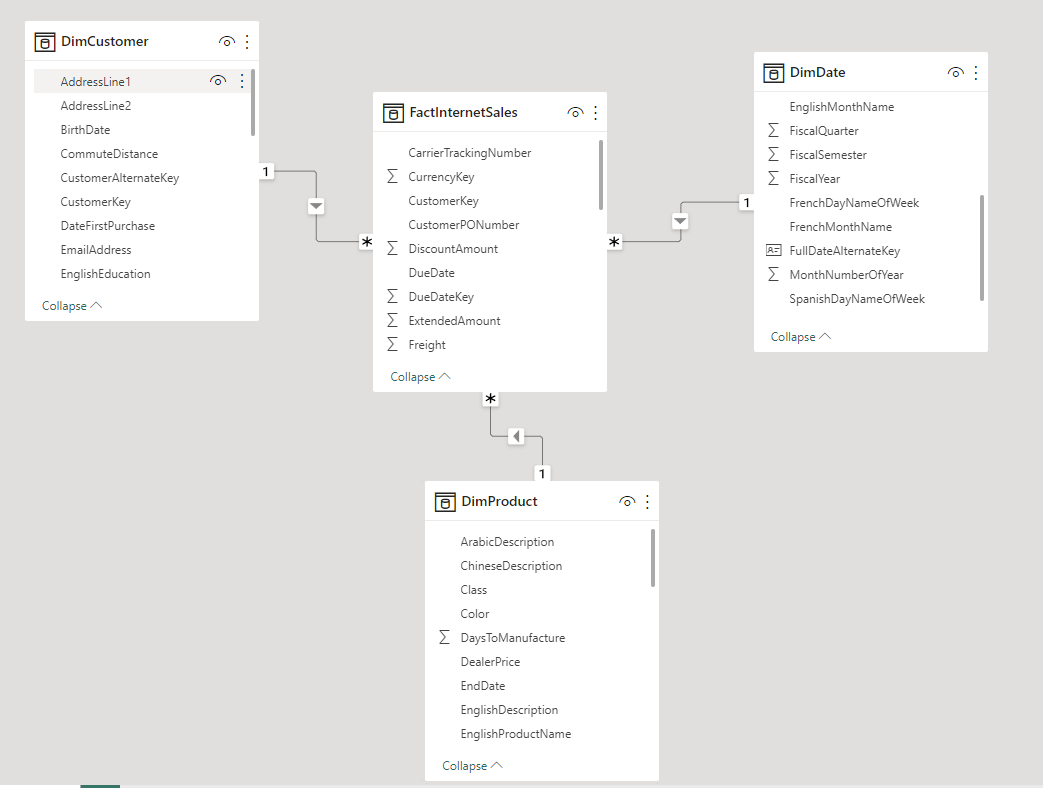
The fields from the three dimension tables are used in slicers on the report page, and the three measures are used in the visual.
The similarity of ALL and ALLSelected
The three measures return the same output with no filter on the slicers. They all show the grand total of Sales.

If we add another table visual to the mix, which slices and dices these three measures by a field from one of the dimensions (EnglishEducation from the DimCustomer), then we will see that the “Sales – No ALL” gets filtered by the EnglishEduction, but the other two measures still show the grand total sales.

So far, in the above example, it looks like ALL and ALLSELECTED are doing the same thing, ignoring any filters. However, there is a big difference; let’s see.
The difference between the ALL and ALLSelected
Now if you filter anything on the slicers, you will see that the values of “Sales – with ALL” and “Sales – with ALLSelected” will differ.
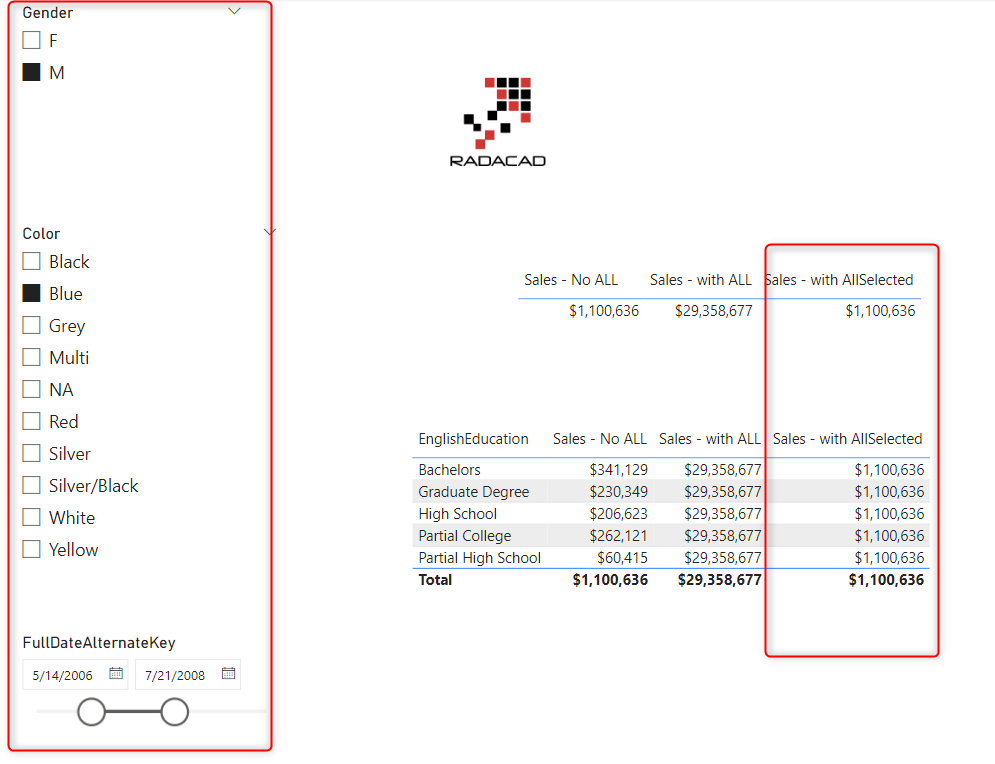
Every filter and slicer is expected to impact the measure “Sales – No ALL” because there is no filter applied to it.
However, when you apply filters on slicers (or any other visuals than the visual that the measure is displayed on it), you will see that the measure with the ALLSELECTED filter gets filtered, whereas the measure with the ALL filter won’t.
The ALL function ignores any filters coming, regardless of the filter being from the same visual or outside. However, the ALLSelected function only ignores filters from the same visual and accepts filters from outside (slicers in this example). As a result, the “Sales – with ALLSelected” is filtered by the slicers but not by the EnglishEducation coming from the same visual.

In the screenshot above, you can see that only filters from inside the visual (such as EnglishEducation, or any other table visual’s fields) are ignored in the calculation for the ALLSELECTED. This is different from how the ALL behaves. From the ALL function point of view, all filters are ignored inside or outside of the visual.
It is important to understand on which table and even which columns the ALL or ALLSELECTED functions are applied; If you apply the ALL function on DimProduct, the output will be totally different. I have explained that in another article here.
So here is the difference
The ALL function ignores any filters coming to the table, whereas the ALLSELECTED ignores only filters from the visual itself.
You may want to understand what is the use case of ALLSELECTED? In calculating percentages, ALLSelected is often used when you want the percentage calculation not by grand total but by the total based on the selection of slicers.

The “Sales % – with ALL” shows the percentage of sales against the grand total of sales ($29M), whereas the “Sales % – with ALLSelected” shows the percentage of sales against the visual total. Depending on how you want to present it, you may use ALL or ALLSelected functions.
I hope this article and video help you with your Power BI solutions. I teach many of these similarities and differences in my Power BI training and coaching sessions. Please reach out if you have any questions.


Reza is author of more than 14 books on Microsoft Business Intelligence, most of these books are published under Power BI category. Among these are books such as Power BI DAX Simplified, Pro Power BI Architecture, Power BI from Rookie to Rock Star, Power Query books series, Row-Level Security in Power BI and etc.
He is an International Speaker in Microsoft Ignite, Microsoft Business Applications Summit, Data Insight Summit, PASS Summit, SQL Saturday and SQL user groups. And He is a Microsoft Certified Trainer.
Reza’s passion is to help you find the best data solution, he is Data enthusiast.
His articles on different aspects of technologies, especially on MS BI, can be found on his blog: https://radacad.com/blog.