ScatterRViz
ScatterRViz is a custom visual for showing three variables in one chart. There is a possibility to zoom in and zoom out on the chart.
This custom visual needs
1- X-axis as the first variable
2- Y-axis as the second variable
3- Color (categorize variable) for the third axis
To use this chart, you need:
1- One R version in your machine
2- Automatically, some of the packages like “plotly,” “ggplot2”, and “htmlwidgets” will be installed.
3- If these packages did not install automatically, then we need to install them in Rstudio via below commands:
Install.packages(“plotly”)
Install.packages(“ggplot2”)
Install.packages(“htmlwidgets”)
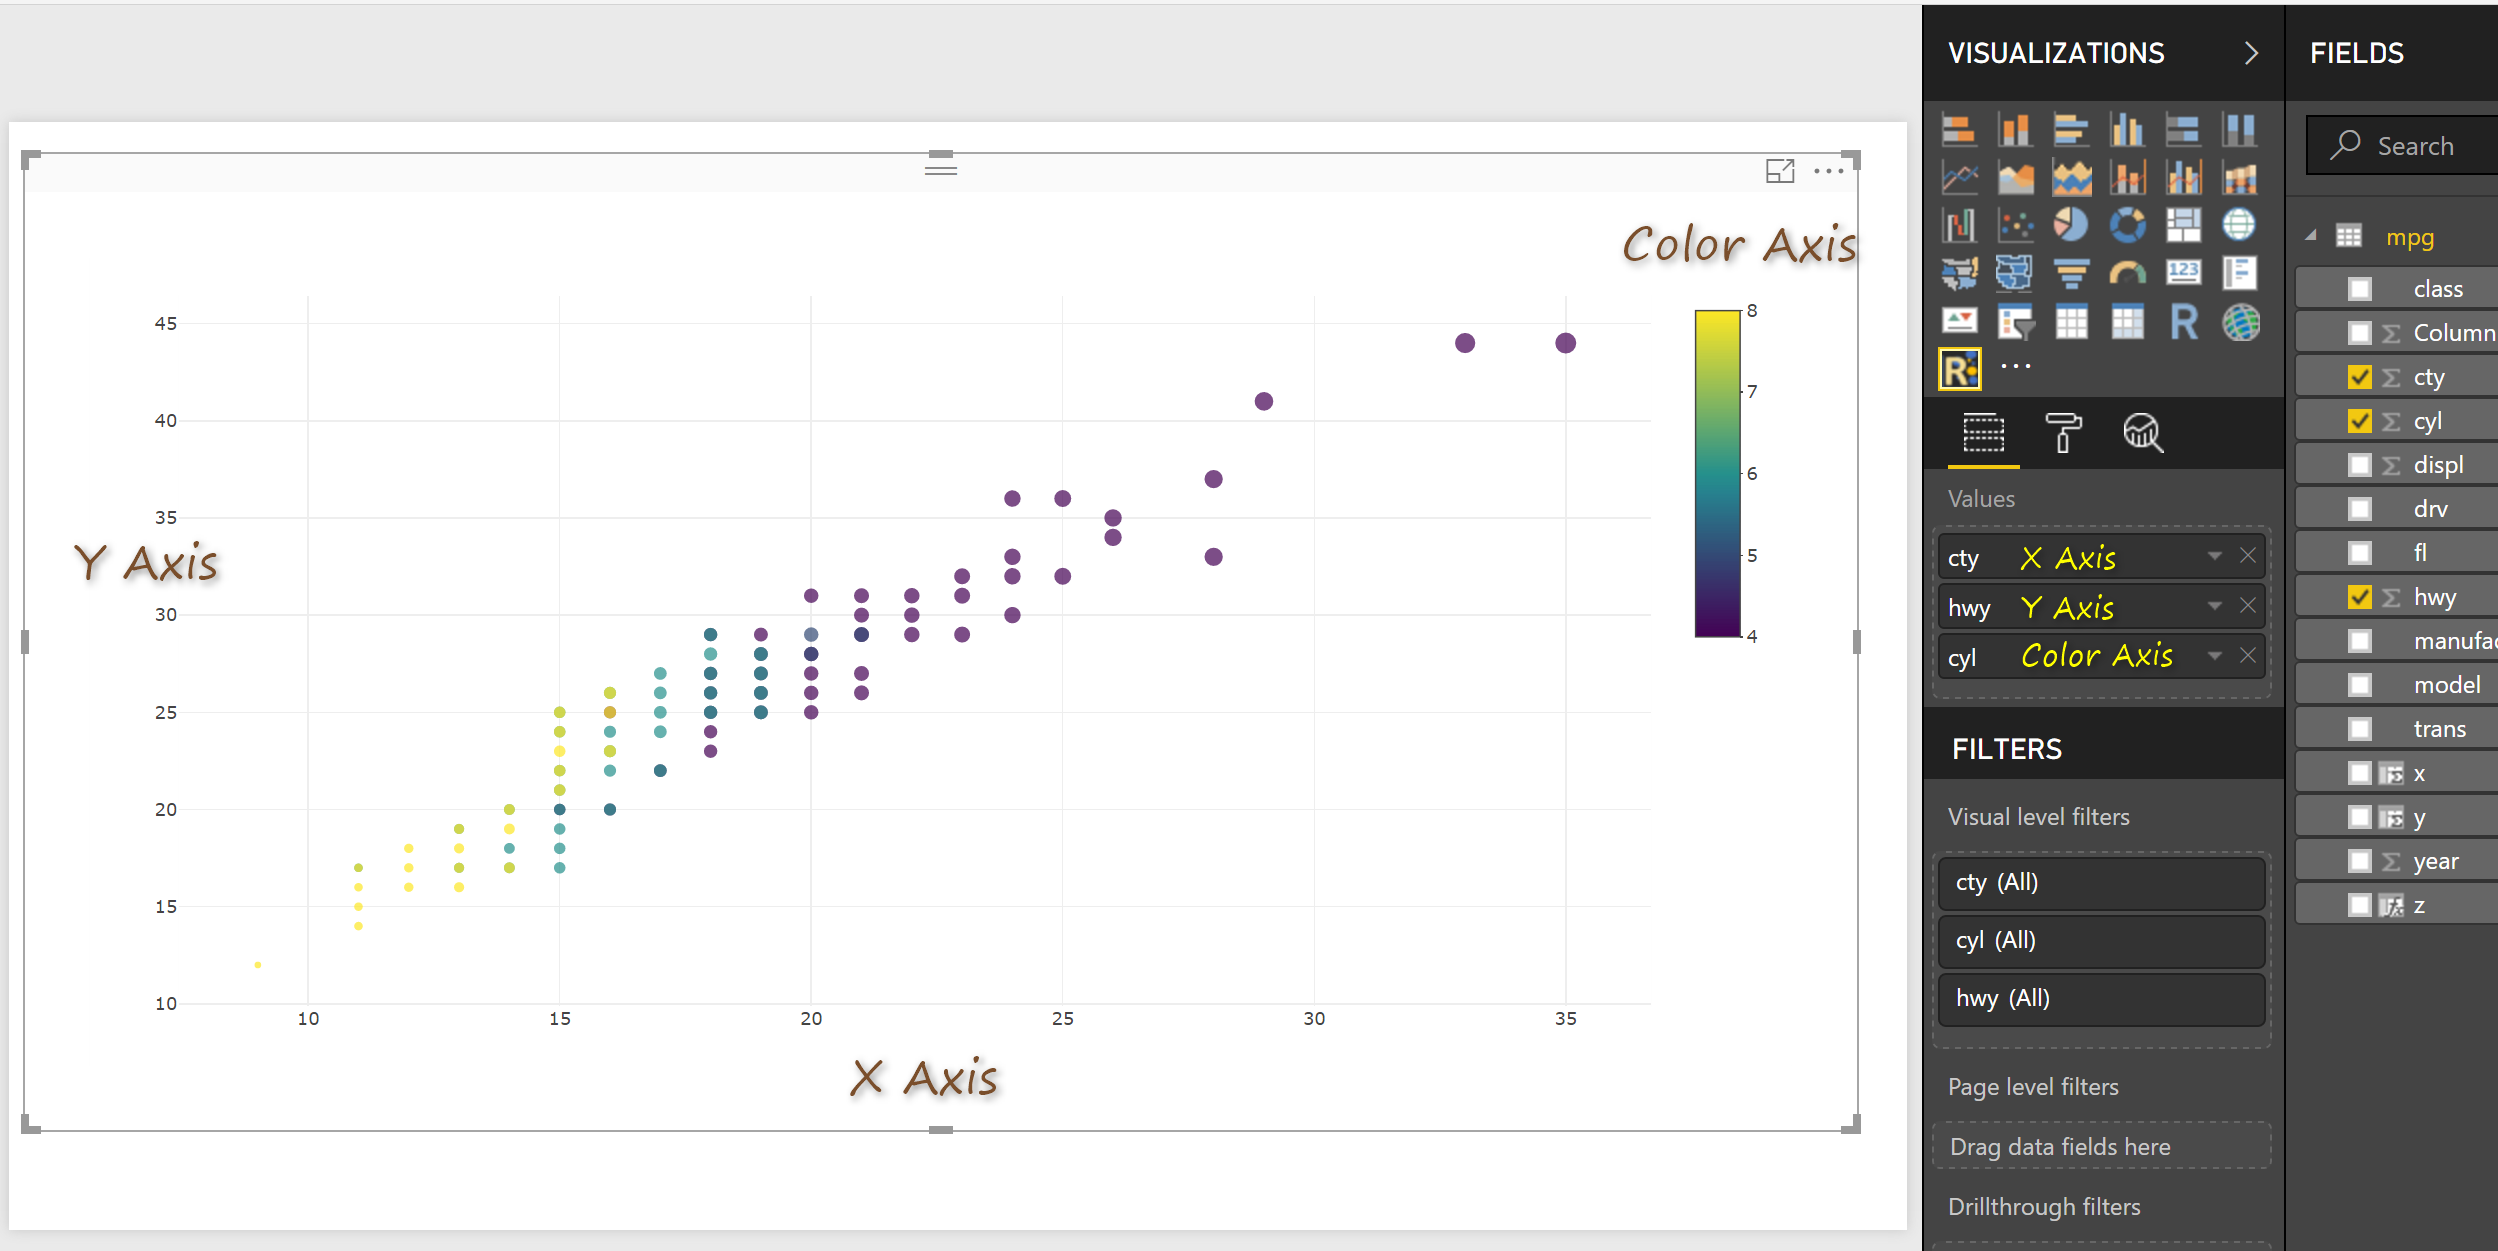
In below example, I have shown the speed in the city and highway with a number of the cylinder as color. The speed in the city has been shown in the x-axis, speed in the highway has been shown on the Y-axis and the number of cylinders will be shown as different color.
Trainer, Consultant, Mentor
Leila is the first Microsoft AI MVP in New Zealand and Australia, She has Ph.D. in Information System from the University Of Auckland. She is the Co-director and data scientist in RADACAD Company with more than 100 clients in around the world. She is the co-organizer of Microsoft Business Intelligence and Power BI Use group (meetup) in Auckland with more than 1200 members, She is the co-organizer of three main conferences in Auckland: SQL Saturday Auckland (2015 till now) with more than 400 registrations, Difinity (2017 till now) with more than 200 registrations and Global AI Bootcamp 2018. She is a Data Scientist, BI Consultant, Trainer, and Speaker. She is a well-known International Speakers to many conferences such as Microsoft ignite, SQL pass, Data Platform Summit, SQL Saturday, Power BI world Tour and so forth in Europe, USA, Asia, Australia, and New Zealand. She has over ten years’ experience working with databases and software systems. She was involved in many large-scale projects for big-sized companies. She also AI and Data Platform Microsoft MVP. Leila is an active Technical Microsoft AI blogger for RADACAD.


