
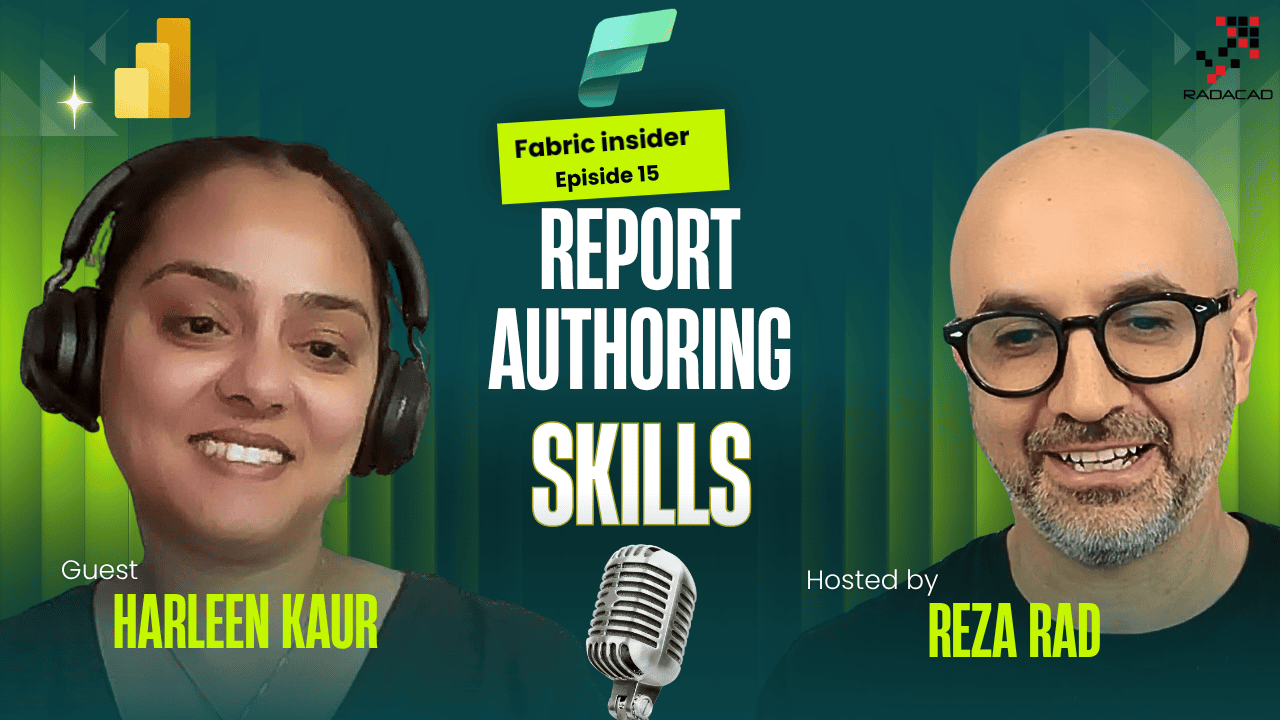
We’ve already covered how AI can build and modify a semantic model using the Power BI Modeling MCP server. But building the semantic model is only half the job, someone still has to build the actual report on top of it. In this episode of Fabric Insider, I sit down with Harleen Kaur, Product Manager on the Power BI Core AI team, to talk through report authoring skills, a set of AI instructions that take you from a blank semantic model all the way to a fully themed, multi-page report, planning, designing, and authoring included.
Meet Harleen Kaur (Video: 0:51)
Reza: Before we get into report authoring skills, can you introduce yourself, which part of the product team you’re on, and how long you’ve been with Microsoft?
Harleen: Hi, I’m Harleen Kaur, and I’m a Product Manager with the Power BI team, specifically part of the Core AI org within Power BI. I’ve been on the team for four plus years now. Some of you might remember me from a dark mode video with Guy in a Cube, and a podcast on your show a couple of years back, also on dark mode. If you attended FabCon Atlanta this year, you might have seen me speaking on our Core Visuals session, covering what we’ve recently released, what’s next, and the roadmap. Excited to be back.
What Are Report Authoring Skills (Video: 2:03)
Reza: These days everyone’s excited about what they can achieve with AI inside Power BI. We already have the function of working with a semantic model through the Modeling MCP server, but report authoring skill is new. Can you explain that to people who haven’t done anything with skills yet, who don’t even know what that is?
Harleen: Let me explain what skills are first. You can think of a skill as a script, a set of instructions or guidance that tells the agent, the worker who’s actually going to do the task, how to do it. Report authoring skill specifically is a script that tells your smart worker, the agent, how to create Power BI reports, how to create visuals, different pages, how to apply a theme, and so on. That’s the nutshell of Power BI authoring skill.
Reza: So this report authoring skill is a set of instructions we provide to the AI agent, GitHub Copilot, Claude Code, whatever it is, and it can then understand and create Power BI reports for us. There are actually multiple reporting skills, three or four of them. Can you explain the differences?
The Three Skills: Planner, Design, and Authoring (Video: 3:29)
Harleen: Let me pull up my blog where I actually walk through the functionality of each. If you check our June monthly release, under the section called AI-powered Power BI Reporting, there’s a diagram showing how these work together. You, the report developer, go to any AI application, GitHub Copilot CLI, for example, type your request, and it routes to the skills.
Say you just have your semantic model and want to build a report, but you don’t have a specific plan and don’t know exactly what to build. You start with report planner. It asks you three to five questions, understanding the audience you want to target, the theme you want, and it’ll also suggest functionality each page could have, and recommend what would work better for your target audience. You select from those options, and it creates a plan for you.
Once you approve that plan, it passes to the report design skill, which comes up with a theme and creates a design brief for you. Once you approve that, it passes to the report authoring skill, which actually creates the report pages and visuals based on the design brief and the plan the planner and design skills produced. That’s how the three skills work together.
If you want more detail, check our Learn documentation, there’s a section explaining which skill to start with depending on your scenario. You don’t always have to start with report planner. If you already have a plan, you can start with design. If you already know your design theme and have your plan, you can simply start with report authoring skill directly.
Reza: I like that we have proper stages of Power BI report development, we don’t just jump straight to building reports, there’s planning, designing, then authoring, which is actually the proper way it should be done. When we work with these, do we have to specify which skill to use, or does it automatically understand?
Does It Auto-Detect Which Skill to Use (Video: 6:54)
Harleen: It automatically understands. You can simply prompt something like “help me create a report based on this semantic model,” and it understands you don’t have a plan yet, so it starts asking questions, automatically triggering the planner skill. It’ll also understand if you don’t have a design format or theme in mind, and trigger the report design skill. But if you’ve already shared a markdown file with your plan, it’ll go directly into the authoring flow, skipping planner, because it understands you already have a specific request and a plan in place.
Live Demo: Building the Semantic Model (Video: 8:00)
Reza: Can we see this in action?
Harleen: Absolutely, let me walk through a demo I recorded for this session. This is an end-to-end Power BI authoring workflow using the agentic workflow. First, I’m asking Copilot to create a semantic model using my SQL database, pasting the connection link. I already have my modeling MCP and modeling skills loaded. The agent works on the request, and I can see live updates happening directly in Power BI Desktop. Once it’s created the semantic model, it provides a summary: how many tables, relationships, measures, and so on, then loads the semantic model into Desktop.
Reza: So this first part is building the semantic model, which we may or may not need, depending on whether we already have one, before moving to the reporting part.
Harleen: That’s correct.
Optimizing the Model with a Best Practices File (Video: 9:20)
Harleen: I can also ask Copilot to improve the semantic model. I have a best practices markdown file, and I share that with Copilot, asking it to optimize my model based on those guidelines. It works through the file, updates the semantic model, and provides a summary of what it changed, I can see measure descriptions right there in the model.
Live Demo: Generating the Report Pages (Video: 10:03)
Harleen: Now the second part of the authoring flow: creating a report based on the semantic model I just built. I already have my functional requirements for the pages, I want a two-page report, one called Opportunities, one called Collab. I ask Copilot to create a report with these two pages and share my functional requirements. It works, and here’s what it created, the Opportunities page and the Collab page, meeting all the functional requirements I specified.
Live Demo: Matching a Reference Theme and Adding a Logo (Video: 11:05)
Harleen: I also want to update the theme and look and feel. I have a reference image, and I want my report pages to look similar to it. I ask Copilot to format the theme and style of the report, share the reference image, and also ask it to add a logo. It works, and it created a report very similar to the reference image, matching the format, styles, colors, and even the logo I asked for on the left-hand side.
Reza: This is amazing. I like how convenient it is, you can use a reference point, like that screenshot, and say “use this theme,” without providing exact theme colors, and it understands. That’s where the power of AI really comes in. In your example you used GitHub Copilot combined with Power BI, but can people use other tools too, like Claude Code, Codex?
Does This Work with Other AI Tools, Not Just Copilot (Video: 12:22)
Harleen: Absolutely, the skills are scalable to other AI applications. Whatever works best for you, you can use the skills there.
How to Get Started (Skills for Fabric Marketplace) (Video: 12:46)
Reza: For people who haven’t used these skills yet, how do they actually get started? Is there a GitHub library to install from?
Harleen: Go back to our Learn documentation, in the overview section you’ll see all the steps to follow. Our skills are part of the Power BI Authoring plugin. Prerequisites: install GitHub Copilot CLI, make sure you have Node.js 18 or later. Then you add Skills for Fabric as a marketplace, since the authoring plugin is part of that repo, and install the Power BI Authoring plugin. This installs all the Power BI-related skills in your CLI, including the report authoring skills, modeling skill, and modeling MCP.
I also want to mention: as part of this release, we haven’t just shipped these three skills, we’ve also released Desktop Bridge and a report management skill that lets you manage reports already published in the Power BI Service workspace. You can learn more about both in our Learn documentation.
Desktop Bridge: Why It’s a Big Deal (Video: 14:05)
Reza: We could have done Power BI reporting with just these skills, but without Power BI Desktop Bridge, what does that actually provide, what’s the main benefit?
Harleen: This is a genuinely powerful tool. The agent can create and work on your request, but it won’t be able to see what it’s created until you have Desktop Bridge available. Once the agent completes or creates the first version of the report, Desktop Bridge validates it, opens the report in Power BI Desktop, takes a screenshot, and for self-diagnosis, identifies any errors, visuals not loading correctly, and tries to resolve those on its own. You don’t have to manually take a screenshot and share it with the agent repeatedly. It also reloads the report automatically in Desktop, so you don’t have to keep closing and reopening it. A very, very powerful tool.
Reza: The fact that it understands what it’s done is genuinely great, otherwise I’d have to open Desktop myself with that report, take a screenshot, and tell it what was created. Now it has that connection built in, which is amazing. You also mentioned the MCP server, and in your demo you used it to create the semantic model before moving to skills. If we just want to build a report, do we still need the MCP server?
Do You Still Need Modeling MCP for Reporting (Video: 16:16)
Harleen: We recommend using it, because report authoring skills are more focused specifically on the reporting part of authoring. If you have any modeling-related changes to make, those go through the Modeling MCP server and the modeling skill. If you have the modeling MCP skill and modeling skill installed alongside the report authoring skill, you bring very powerful tools together for an end-to-end authoring experience. So it’s not strictly needed if you’re only focused on the reporting experience, but we recommend using it alongside the reporting skills.
Coming to the Service, Not Just Desktop? (Video: 17:15)
Reza: This currently works with Power BI Desktop. Any plans to bring it to the Service in the future, generating reports directly there?
Harleen: That’s a very valid, very good question, Reza. I won’t say a lot, but this is just the start, keep looking out for this space, we have a lot to cover.
What’s Coming Next (Video: 17:46)
Reza: These reporting skills and Desktop Bridge are both in preview right now, so I’m sure there will be plenty of updates. What’s the future plan, what should we look forward to?
Harleen: We’ve just gotten started, Reza. There’s a lot we want to improve and include in report authoring skills. Feedback from the community is very welcome, if there’s anything the community wants included that’s missing, or anything not working as expected, share that feedback with us in the Git repo, and we’re working fast to make sure those issues get resolved. We’re just getting started, there’s a lot of surface to cover, and a lot coming, in the very near future in fact.
Where to Send Feedback (Video: 18:56)
Reza: For our audience to reach out with feedback or questions, what’s the best channel?
Harleen: We have an issues section in Skills for Fabric that we actively track, for any issues or feedback related to the skills we’ve shipped. If anything isn’t working for you, or you have a new request, go to that issues section and share it with us. We try to reply back and resolve issues as soon as possible.
Reza: Is there anything else related to report authoring skills, or your working area in general, that I haven’t asked about?
Harleen: I think you’ve covered most of what I wanted to share. Definitely give it a try, and share your thoughts on the skills, if there’s anything you want us to work on, we’re looking forward to hearing your feedback.
Reza: Thank you for your time, Harleen, and thank you for working on these skills, which is fantastic, it genuinely helps us build Power BI reports much faster. Really appreciate your time.
Harleen: Welcome, bye-bye.
Summary
Planner, design, authoring, and now Desktop Bridge closing the loop so the agent can actually see and self-correct what it built, this is a genuinely complete report authoring workflow, not just a single prompt-to-visual trick. If you build Power BI reports and haven’t tried these skills yet, it’s worth setting up. If you have questions or feedback, drop them in the comments, or better yet, in the Skills for Fabric issues section where Harleen’s team is actively tracking them.
Related Reading on RADACAD
- No-Code Power BI Report Authoring: GitHub Copilot, Fabric Skills, Power BI Desktop Bridge
- No-Code Power BI: How to Use Claude and the Power BI Modeling MCP Server
- No-Code Dataflow Gen 2 in Microsoft Fabric Using GitHub Copilot and Fabric Skills
- Fabric Core MCP Server (OneLake Security demo)
Previous Fabric Insider Episodes
- Ep. 1 Wilson Lee, Mirroring/Copy Job/SAP: https://youtu.be/LRrqxRP2ltk
- Ep. 2 Zoe Douglas, Visualization Updates: https://youtu.be/PDEYc37VbE4
- Ep. 3 Miguel Escobar, Power Query/Dataflows: https://youtube.com/watch?v=mgxEYGKgYis
- Ep. 4 Santhosh Kumar Ravindran, Spark Performance: https://youtube.com/watch?v=VayYW4REKzc
- Ep. 5 Christian Wade, Semantic Models: https://youtube.com/watch?v=zndWuBB1JTo
- Ep. 6 Yitzhak Kesselman, RTI/Fabric IQ: https://youtu.be/euaMnOWD81Y
- Ep. 7 Rie Merritt, MVP Program: https://youtu.be/d6iAp7clwzc
- Ep. 8 Hasan Abo-Shally, MCP Servers/CLI: https://youtube.com/watch?v=TTqyHBAHuP4
- Ep. 9 Wee Hyong Tok, Data Integration/ETL Future: https://youtube.com/watch?v=nDPufHNSC5Y
- Ep. 10 Mohammad Ali, Next Evolution of Power BI: https://youtube.com/watch?v=jpGtEvKty-k
- Ep. 11 Sachin Patney, Fabric Apps/Rayfin: https://youtu.be/PjV1bc1Rqwo
- Ep. 12 Josh Caplan, OneLake Updates: https://youtu.be/R5i-CigLwSM
- Ep. 13 Kay Unkroth, DAX UDFs/OAP: https://youtu.be/yyui7FV9NmY
- Ep. 14 Rui Romano, PBIP/PBIR/Agentic AI: https://youtu.be/-YH-Yue_pPY
Full playlist: YouTube Podcast: Spotify Series page: radacad.com/category/fabric-insider-2026
About Reza Rad
Reza Rad is a Microsoft Regional Director and a 16-year consecutive Microsoft Data Platform MVP, recognized as one of the world’s leading voices on Power BI and Microsoft Fabric. He is co-founder of RADACAD, a Microsoft Gold Partner delivering Power BI and Fabric consulting and training to organizations across 80+ countries, and co-founder of the Difinity Conference and the Power BI & Fabric Summit. Reza has authored more than 10 books on Power BI and Microsoft BI technologies, published over 1,000 technical articles, and personally trained thousands of data professionals worldwide. Whether you need a full analytics architecture built from the ground up, a stuck DAX formula or performance issue solved, or a team trained from the basics to advanced Fabric implementation, Reza and the RADACAD team offer both hands-on consulting and structured training to get you there. Learn more at radacad.com.


Reza is author of more than 14 books on Microsoft Business Intelligence, most of these books are published under Power BI category. Among these are books such as Power BI DAX Simplified, Pro Power BI Architecture, Power BI from Rookie to Rock Star, Power Query books series, Row-Level Security in Power BI and etc.
He is an International Speaker in Microsoft Ignite, Microsoft Business Applications Summit, Data Insight Summit, PASS Summit, SQL Saturday and SQL user groups. And He is a Microsoft Certified Trainer.
Reza’s passion is to help you find the best data solution, he is Data enthusiast.
His articles on different aspects of technologies, especially on MS BI, can be found on his blog: https://radacad.com/blog.