
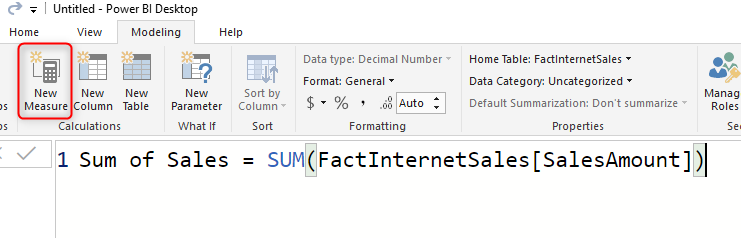
You have created a Power BI report with many visualizations and calculations, however, it is slow! And the slowest part of that is the report page with a matrix or table visual in it! Why that visual is so slow? Is this the problem of Visual in Power BI? or Power BI problem at all? or something to do with the modeling and calculation? I get this question a lot from my clients at the beginning of consulting work or from my students at my courses. In this article, I’m going to explain why the matrix and table in your Power BI report might be slow, and what you should do about it? To learn more about Power BI, read Power BI book from Rookie to Rock Star.
Measures
Most of the time, you get the performance problem when you use Measures in the matrix or table visual. That being said, I have seen models that even showing a column in table or matrix visual is slow, and the reason for that most of the time is bad design and bi-directional relationship. Having a badly designed model always hurts. Let’s talk about the scenario that 99% of the time happens; When you have measures in your table and matrix visuals, and you feel that it is slow, and sometimes VERY slow.
How Measure Works
A Measure is one of the three types of calculations you can create in Power BI. The other two types of calculations are; Calculated Table and Calculated Column. I have written in details about differences between Measures and Calculated Columns in this article, And I recommend you to read that article to get the full picture of what is the best type of calculation for your scenario. Let’s have a look at how Measure is calculated;
Measures are calculated on the fly!
Measures are not pre-calculated values. The only type of calculation in Power BI, which is not pre-calculated is the Measure. Measure calculation will happen on the fly, right at the time when you change a value in the slicer, filter, or click on a visual to highlight something. Every interaction like those will trigger the evaluation of a measure to happen.
Measures Consume CPU
Because Measure calculation should happen immediately after the interaction through other visuals, this calculation happens using the processing unit of CPU. At the time of calculating measures, you can sometimes notice it (if the calculation takes a long time) that the CPU usage suddenly goes up to 100%, and after finishing the calculation goes back down.
Measures Consume Memory! Yes, they do sometimes!
Measures are mainly consuming the CPU, however, they sometimes also consume memory. Let’s take below calculation into consideration:
MINX ( Customer, [Sum of Sales Amount] )
The calculation above is using an iterator, and the way that iterator works is: SUMX will go through every single row in the Customer table, calculate the expression (Sum of Sales Amount) for each row, and store it in temporary memory, and then finally after going through all rows, it sums them up to give us the final output. (Thanks to Marco Russo for the guide)
As you see, there is temporary memory consumption. Although the measure itself is not stored anywhere and doesn’t take memory for storing the final output, there might be memory consumption for temporary calculations. This memory consumption is not just happening with iterators. there are other scenarios functions and expressions that might cause this.
Why Measures Can be Slow at Table and Matrix Visuals
A Measure is calculated on the fly, they consume the processing power of CPU, and also temporary memory, so it is obvious that measures will take some time to do the calculation. However, you might notice the performance problem at Table and Matrix first, Why?! The fact is that measures are calculated per combination of values in the filter context (The set of values that effect on calculating the output of a measure).
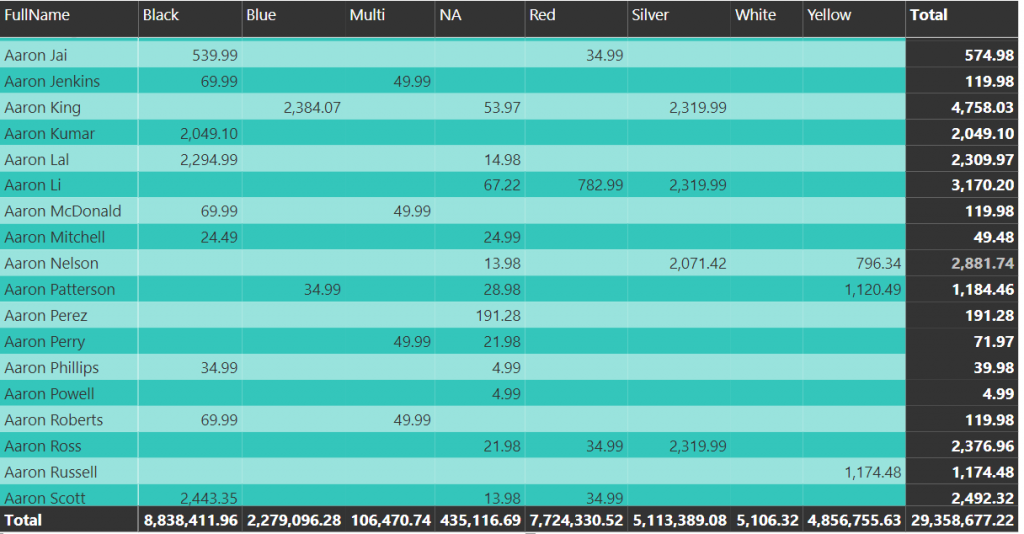
As an example, in the table below, each time, we select a value in the slicer, Six calculation happens at the same time! One calculation for each row in the table:
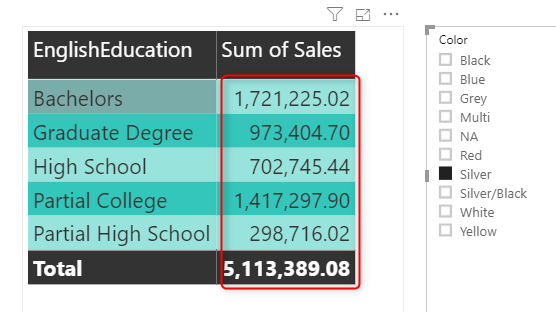
You might wonder why Six times, The number of rows are Five. Note that the total row is just another calculation, a calculation without any filter on the EnglishEducation field. So every time you click on the Color, there will be Six calculation happening. Let’s check another example in a matrix then:
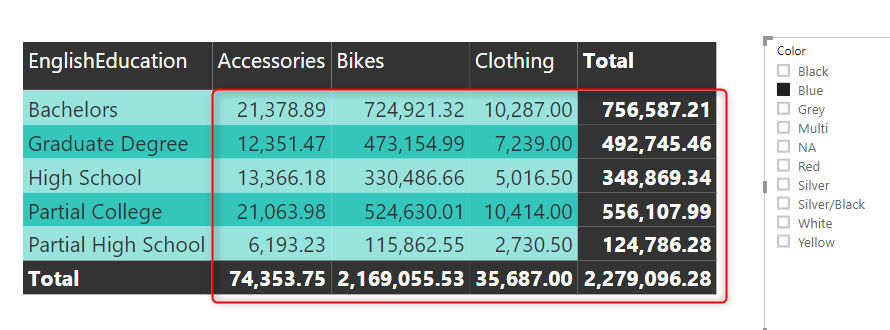
This time in addition to Six rows, we also have Four columns, so the calculation happens 6*4=24 times. Every time you select a Color value in the slicer, 24 calculations happen! What if that matrix has many rows and more columns:
I have 18K customers as rows, and Nine columns, You can do the math now! This would be more than 160 thousands of calculation whenever you change a value in a slicer!
Now let’s imagine each calculation takes 1 second (which is not much), and it consumes 1MB of memory. For 160K calculations, you can realize how long it can take, and how much memory. The fact is that the Power BI in-memory engine does a lot of parallel processing and compressions and etc. So you won’t end up with 160GB memory consumption or 45 minutes wait for this table, it would be much less. However, still, there will be parts that cannot be processed parallel or parts that consume memory despite the compression level.
When the calculation happens in Card Visual, it is only calculated once. When it happens in a column chart, or bar chart it happens only for a few items (because you won’t put a field with thousands of values in those visuals). However, when you use a table and especially matrix visual, you want to show the details, and you bring a field with a lot of values. So you end up with thousands and sometimes millions of calculations, and that is why your report becomes slow.
When you put the measure calculation in a matrix or table visual, the detailed context of fields in these visuals, cause thousands and sometimes millions of calculations.
Please note that for simple calculations, or calculations written in a properly designed model, this would be still super fast. Even with many records and columns. The challenge is when the measure calculation is not performing well by itself.
Now that you realized why your table or matrix visuals are slow, let’s see what is ways to make it fast.
Solution: Performance Tune the Measure, Design a Proper Data Model
If you really want to solve the issue in the proper way, you should be looking at two things: Your data model design, and your measure performance. These two are tightly related to each other. Without a proper data model design, you cannot have a good performing measure. There are tons of details to discuss when it comes to modeling and calculation best practices. This article is not the right place to discuss it. I have written a series of articles about basics of modeling in Power BI, which I highly recommend you to read, and build a proper data model for your Power BI implementation;
- What is a Relationship?
- What is the Cardinality of the Relationship?
- What is the Direction of the Relationship?
- Data preparation; First and Foremost Important task
- What is a Dimension table and why say No to a single big table
- Basics of Modeling in Power BI: Fact Tables
- Combining Dimension Tables in Power BI using Power Query; Foundation of Modeling in Power BI
- Star Schema and How to Build It
- Creating a Shared Dimension Using Power Query and Power BI
- Build Your First Star Schema Model in Action

Most of the time, I have seen models that have many tables all related to each other with bi-directional relationships, and hence; the performance problem. Consider Star Schema design Seriously!
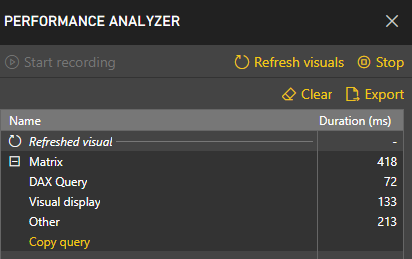
In Power BI Desktop also we have the Performance Analyzer now, which helps to find out which visual runs slower, and find out the DAX calculation for it, to be able to performance tune it further on. I will write about this more soon in another article.
I highly recommend you to reconsider your data model, and check the calculations to be written in the right way.
Solution: Consider Pre-Calculation
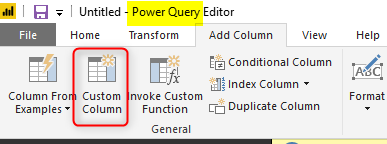
Not all calculations should be done at runtime! There are many calculations that should be done row by row anyways! Most of the row-by-row calculations can be evaluated beforehand. Then the selection of slicer will just filter down the number of rows in the output and also the aggregation happens on the filtered rows. The actual row-by-row calculation happened beforehand. There are two ways that you can do calculations beforehand; using Calculated Columns, or using Power Query. I strongly recommend the Power Query method. If there is a row-by-row calculation in your scenario, do it through Power Query. Then the measure can be much simpler, it can be aggregation on top of it.
Talking about moving your calculations for row-by-row operations from measure to Power Query is not a short discussion, we can discuss it in many articles, and it is one of the series that I have in my backlog to write about. So stay tuned for it.
I had clients, which their matrix and table visual took more than 10 minutes to respond, and with some changes in the data model, and moving row-by-row calculations to Power Query, it ran under 3 seconds! Don’t pass over this lightly. This can save your report.
Workaround: Reduce The Number of Calculations
The ultimate solution for your scenario is what I mentioned first; To design a proper model, performance tune the measure calculation, and more row-by-row calculations to Power Query. However, sometimes you are looking for a quick remedy! Although I’m not a big fan of quick remedies, they are helpful occasionally.
It is like when you go to a doctor because of a headache. Doctor after some testing and experiments will tell you what is the actual reason for it, you have to fix that to get well. And that is the solution, but it takes days, months, and sometimes years. In the meantime, the doctor will prescribe some pain killers for you to be able to overcome the pain. pain killer is not the solution, it is just a short term remedy, but helpful. So here it is the pain killer for your performance problem.

So the workaround is to reduce the number of calculations. How you can reduce it? with reducing the number of rows (in table and Matrix), and/or reducing the number of columns in the matrix, and reducing the number of measures (values in table or matrix). A table with Five rows will have half of the calculation than a table with 10 rows. A matrix with 10 rows and 5 columns will have 10 times less calculation than a matrix with 100 rows and 5 columns. This is just simple math.
You might say, but I want to show the detailed data, I cannot remove it, here is the way to do it:
Consider Master-Detail Report Design
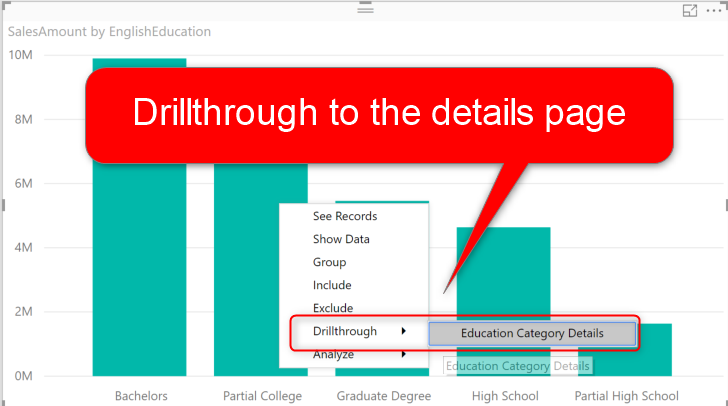
If your matrix and table visuals are showing the detailed data, then that is a page that user will navigate through it only for checking selected filters. You need to have a master page (or multiple master pages), and then using Drillthrough function in Power BI, give the user the ability to navigate to the details. Using drill through will filter the data when it comes to the details page, and as a result, the number of calculations will be lower, and the performance would be better. Learn more about how to implement a master-detail report in Power BI here.
Summary
Your matrix and table visuals are not slow because of Power BI! They are slow because of the bad data model, and not-well performing measures. Your solution is to properly design the data model, and performance tune the calculation. However, there are some quick remedies, such as reducing the number of calculations using the Drillthrough filter in Power BI. I will write more about the performance of the Power BI report soon in another series.
Do you have a performance issue with your Power BI report? share your concerns with me, and feel free to contact me if you need consulting help.


Reza is author of more than 14 books on Microsoft Business Intelligence, most of these books are published under Power BI category. Among these are books such as Power BI DAX Simplified, Pro Power BI Architecture, Power BI from Rookie to Rock Star, Power Query books series, Row-Level Security in Power BI and etc.
He is an International Speaker in Microsoft Ignite, Microsoft Business Applications Summit, Data Insight Summit, PASS Summit, SQL Saturday and SQL user groups. And He is a Microsoft Certified Trainer.
Reza’s passion is to help you find the best data solution, he is Data enthusiast.
His articles on different aspects of technologies, especially on MS BI, can be found on his blog: https://radacad.com/blog.
Dear Reza
Thanks for your helpful posts.
I have a data model in SSAS that has a live connection to another server and get data from it, as one of the external servers.
I have a question in this regard. How much does our model design impact that external server? and by optimizing or model or measures I can have a good performed and faster data reading from an external server?
Thanks for your advice in advance.
Hi.
It depends on what SSAS version/edition you are using.
And the way that you read the data from the source is important. for example, the new versions of SSAS tabular use Power Query for get data, which is different from the prior methods.
The best practice is, however, always to build a Data Warehouse. and then use that as a source, which won’t need much of transformation afterward
Cheers
Reza