
Microsoft Fabric, as an end-to-end SaaS, provides multiple workloads, including Data Science. In this article and video, you will learn the Data Science workload in Microsoft Fabric, what it includes, and how it works with other Fabric workloads.
Video
Microsoft Fabric
Microsoft Fabric is an end-to-end Data Analytics software-as-a-service offering from Microsoft. Microsoft Fabric combined some products and services to cover an end-to-end and easy-to-use platform for data analytics. Here are the components (also called workloads) of Microsoft Fabric.

To learn more about Microsoft Fabric and enable it in your organization, I recommend reading the articles below;
How does Data Science Work?
Data Science is a mouthful term, a buzzword in many places nowadays. But what is it? Data Science is the process that uses scientific computing and methods and algorithms to extract knowledge and patterns from the data. A Data Scientist is the person who does this process.
From the definition above, it is clear that there is a process to get knowledge and insight from the data. This process is more or less the same for all the data science applications. Here is the process in a diagram explained beautifully (source: https://learn.microsoft.com/en-us/fabric/data-science/data-science-overview)
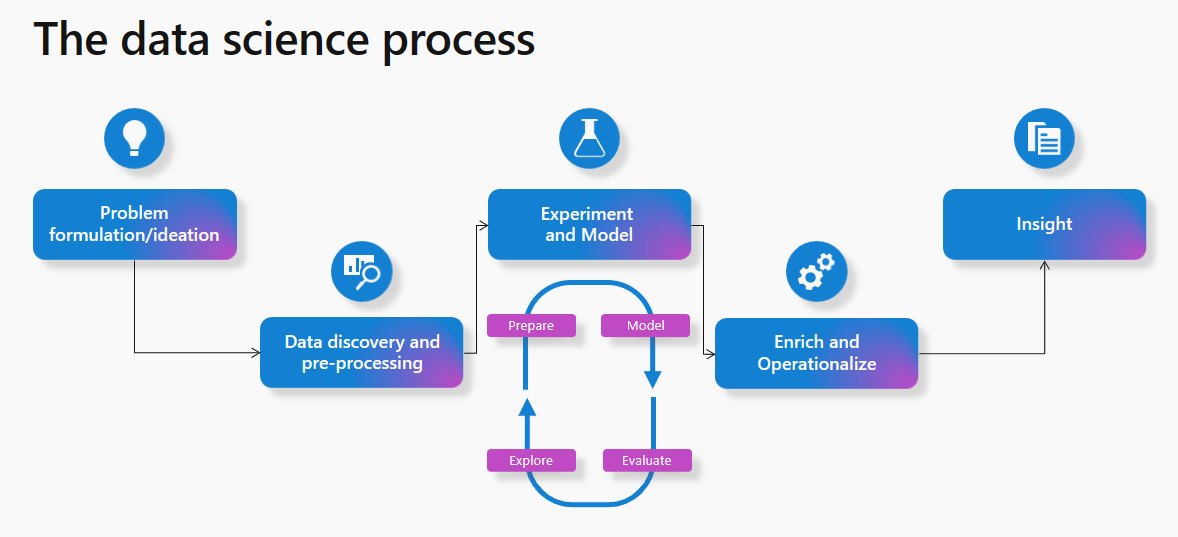
The process includes the following steps;
- Problem definition
- Data discovery and exploration
- Experiment and Model
- Operationalize
- Insight
The problem definition is where the ideas define the question; for example, What products do customers usually purchase together? Or how to find fraudulent transactions automatically? , etc.
To find out if it is possible to solve the problem, you first need to explore the data, look at it from different aspects, analyze it by different factors, and discover the data fields.
Once the data discovery and preparation are done, you must create a model from the data that trains itself with the pattern, find the patterns in the data, and go through this loop of training, modeling, evaluation, and discovering. This might go through many cycles until the model reaches the operational stage. During this step, the model finds patterns, and the patterns will be tested with the data to see if they produce the expected outcome and what is the model’s success rate. The cycle might continue until a reasonable success rate is reached.
Once the model is operationalized, it will be applied to the actual data, which might be in a file in a data warehouse or elsewhere. The output of this data can then be ready for visualization and insight.
The outcome will be presented in an easy-to-understand way to the user. For example, these are products that customers purchase together, or if this customer purchased product A, then we can recommend him/her product C because these two are often purchased together.
The data science process itself is a cycle. Once the insights are reached, it will help pose other questions and data science problems, and the process starts again.
That is how the data science process works, regardless of the technology. Any vendor, application, or service that offers Data Science capabilities should have the tools, services, and means by which the process above can be accomplished.
Microsoft Fabric for Data Science
Since Microsoft Fabric is an end-to-end analytics service, it makes sense to have the means for data science, too. Here are tools, Fabric items, and libraries that help the Data Science to happen, or in other words, parts of the Data Science workload of Microsoft Fabric.
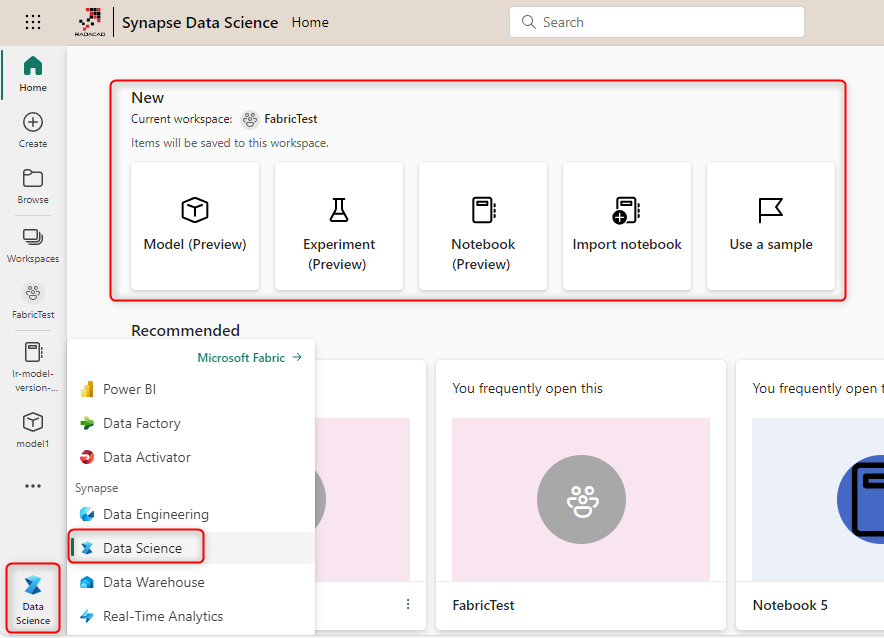
Tools
Multiple tools in the Fabric portal are available for data scientists to do their jobs. These include the following;
- Notebook
- Data Wrangler
- Power BI
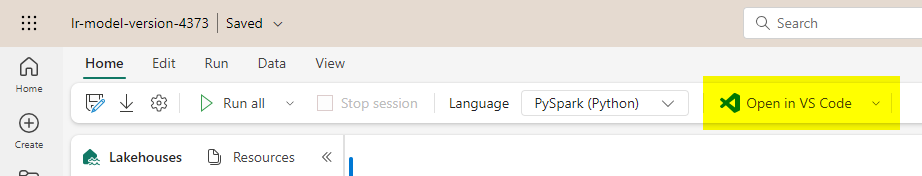
- Visual Studio Code (or other coding tools)
Notebook is the most commonly used tool for data scientists in the Fabric environment, mainly because it enables developers to use languages mentioned in the next section. Here, you can learn more about Notebook;

Data Wrangler is a graphical user-interfaced editor for data preparation and exploration that can be launched from a Notebook. For Data Wrangler to work, the data has to be loaded into a data frame using the Pandas library. Data Wrangler can simplify the data scientist’s job using the UI and Python code-generating function.

Learn more about Data Wrangler here;
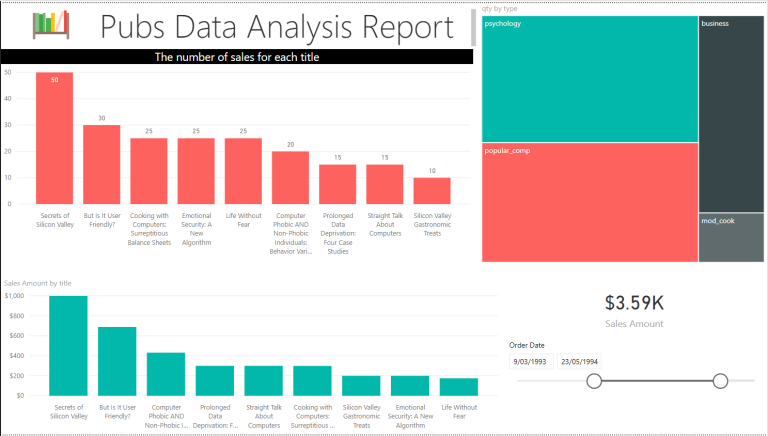
Power BI is not only a tool for data analysts, but data scientists can use it to connect to the data output they generate after the data science process. Their output data might be stored in a Lakehouse, where Power BI can have a Direct Lake connection to the Lakehouse for presenting the data.
Learn more about the Direct Lake Power BI connection here;
Languages
There are multiple languages in which a data scientist can write code for the data science process in Fabric.
- PySpark (Python)
- Scala
- SparkR
- Spark SQL
The four language above provides a wide range of capabilities. Here is what each language is designed best for;
R is a language for statistics, with many libraries and functions for machine learning.
Python is best for data scientists to use for a deep learning scenario; it has many libraries.
Scala provides scalability features in the language.
SQL is the query language used for relational databases for many years, and with powerful querying capabilities, it is a vital language for data discovery and preparation.
The combination use of the four languages above provides the data scientist the ability to do the entire data science process.
Objects (Fabric Items)
There are multiple objects in Fabric that data scientists work with. The following are some of the most commonly used;
- Lakehouse
- Model
- Experiment
- Semantic Link
A Lakehouse is a place to store structured and non-structured data. The Lakehouse’s data can be read or written using Notebook. There are other tools that can read from Lakehouse (such as Power BI using Direct Lake) and tools that can write into Lakehouse such as Dataflow Gen2 and Data Pipeline.
Unfortunately in Fabric, there is no rich graphical user interface such as Azure Machine Learning Studio to build the models using the GUI, so the model needs to be built using the languages mentioned above and libraries such as Scikit-learn, SynapseML (formerly known as MMLSpark), XGBoost, PyTorch & Tensorflow.
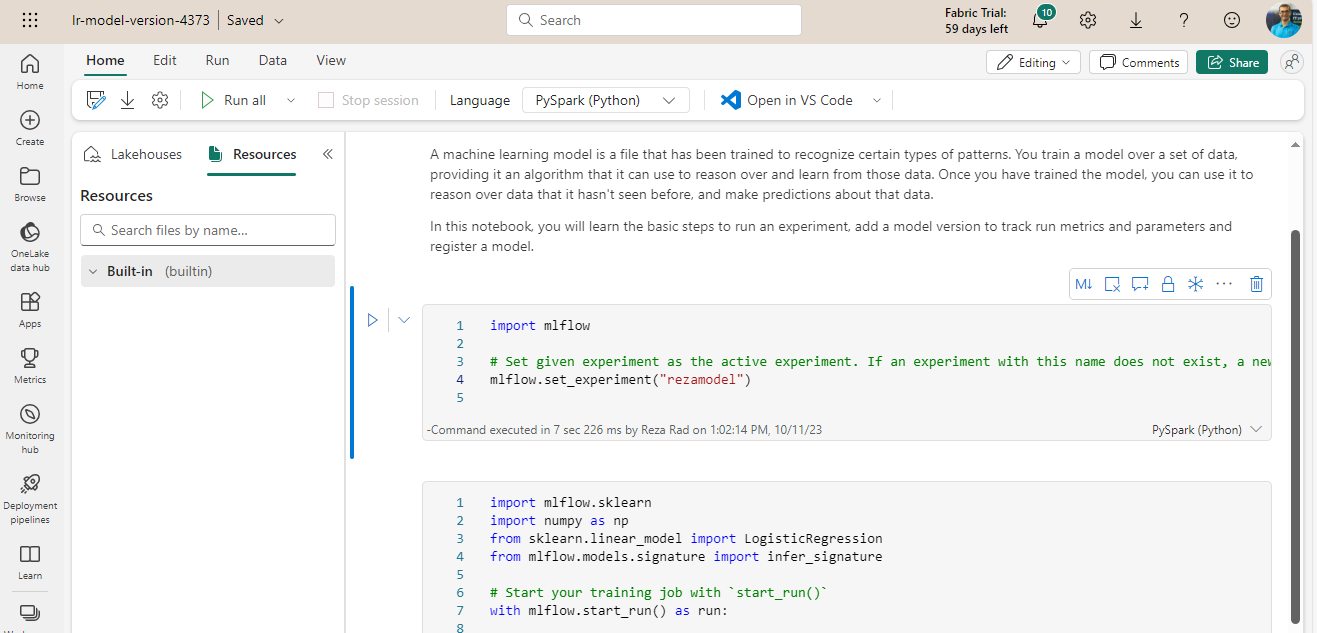
An Experiment is the whole environment around the model which includes things such as logging, monitoring, and machine learning runs related to the execution of the model. If you consider the model as a program, the Experiment is like the project that surrounds the program.
The Experiments in Fabric are the built-in MLflow experiences that provide means to run, track, and log the model executions in the Fabric.
Semantic Link is not a Fabric item. However, because it creates a connection between two important items, I thought of explaining it here. Often a business analyst or data analyst is working with data in their Power BI dataset which they have business rules and logics around it. Instead of the data scientists re-inventing the wheel and trying to apply business domain knowledge on the raw data to get it ready for machine learning processing, it would be beneficial if the Power BI dataset could be used directly as the source of the machine learning process. That is exactly what Semantic Link is doing. It provides a way for data scientists to use the Power BI dataset for their machine-learning model. On the other hand, the outcome of operationalizing the model can be written in Lakehouse which then can be used in Power BI for further insight. Semantic Link connects the data analyst and the data scientist together.
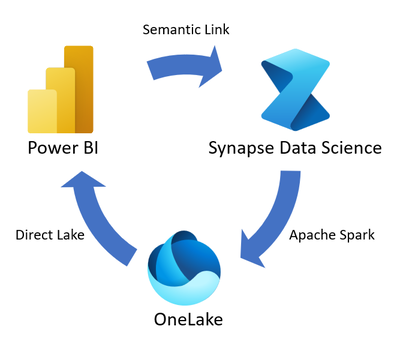
Image source: https://learn.microsoft.com/en-us/fabric/data-science/semantic-link-overview
Summary
This article provided a summary of what is included in the Data Science workload of Microsoft Fabric. The data science process includes steps such as data discovery, exploration, modeling, and training, testing the model, operationalizing it, and gaining insights. Fabric provides objects, services, tools languages, and libraries for the entire process. This includes tools such as Notebook and Data Wrangler, objects such as Model and Experiment, and languages such as PySpark, Scala, etc. These combinations enable the data scientist to be able to have their data science process as part of the bigger data analytics project in Microsoft Fabric.


Reza is author of more than 14 books on Microsoft Business Intelligence, most of these books are published under Power BI category. Among these are books such as Power BI DAX Simplified, Pro Power BI Architecture, Power BI from Rookie to Rock Star, Power Query books series, Row-Level Security in Power BI and etc.
He is an International Speaker in Microsoft Ignite, Microsoft Business Applications Summit, Data Insight Summit, PASS Summit, SQL Saturday and SQL user groups. And He is a Microsoft Certified Trainer.
Reza’s passion is to help you find the best data solution, he is Data enthusiast.
His articles on different aspects of technologies, especially on MS BI, can be found on his blog: https://radacad.com/blog.