
I use Power BI for analyzing any data! and recently realized that there is no public report about SQL Saturdays around the world, hence, I build this report. This report is using live data from SQL Saturday website.
What is SQL Saturday
If you don’t know what SQL Saturday is, here is some information:
SQL Saturday is a free day of learning, training and networking ran by local community leaders in association with a non-for-profit organization called PASS. In Auckland, we ran so far a few of these events. The name of the event is SQL Saturday, but it includes anything in the data world. Audience usually love the event. Each event might have multiple tracks, local or international speakers, and many sessions all delivered in a Saturday. There are almost 1000 SQL Saturdays around the world. The report below is created from the SQL Saturday website.
Check out the interactive report
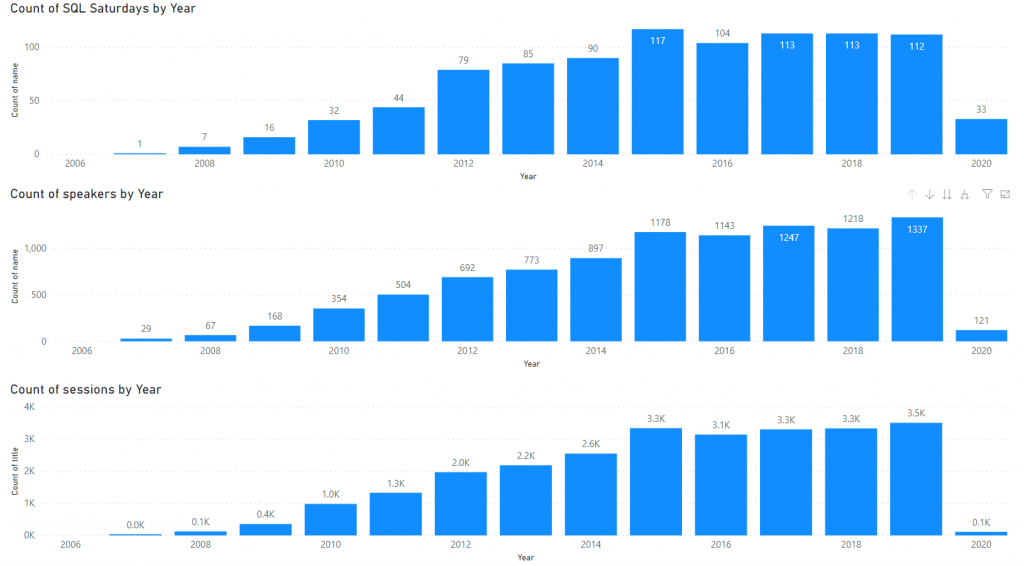
What information is available in the report?
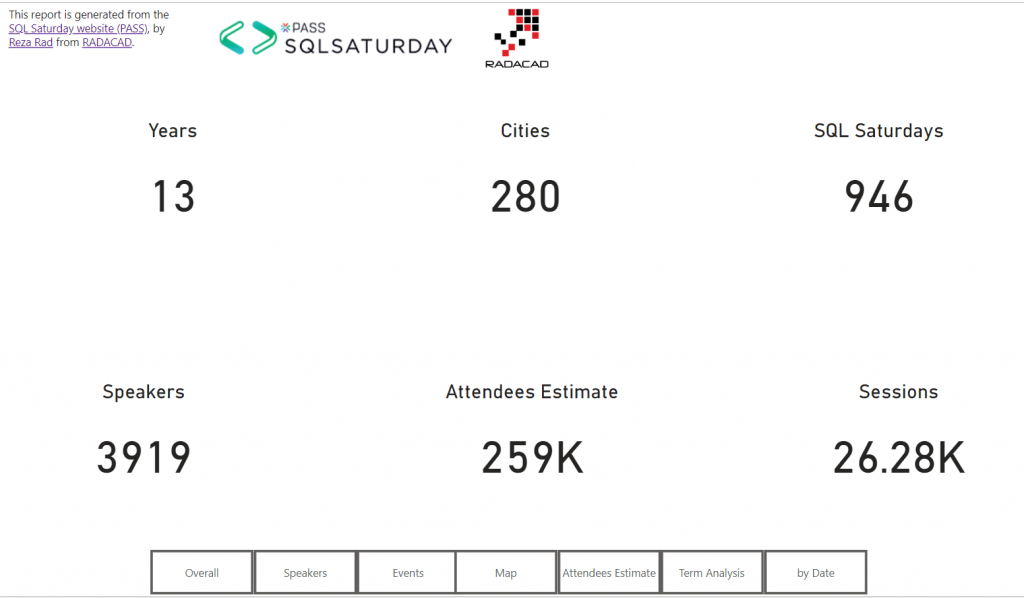
Overall
In overall PASS done an amazing job, and wonderful result to be proud of. Hats off to all organizers, and PASS for this amazing results.

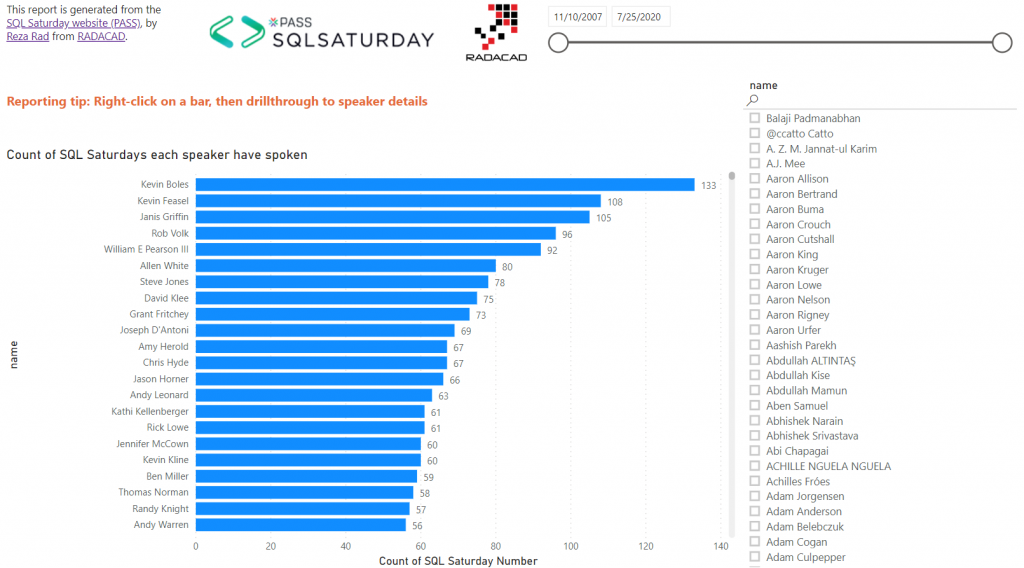
There are ways that you can analyze the report by speakers, and see how many events each speaker have spoken:
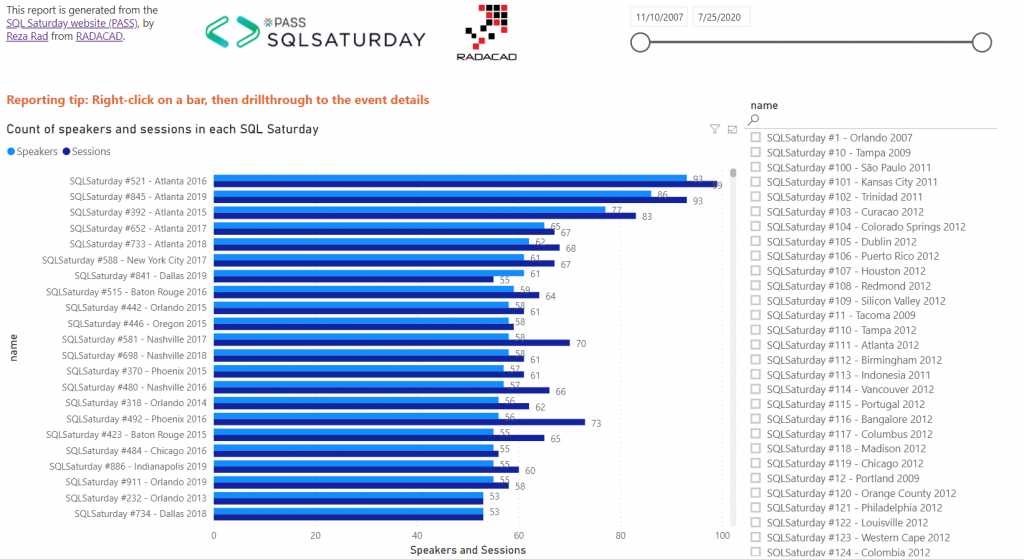
Or find out how many speakers in event had:
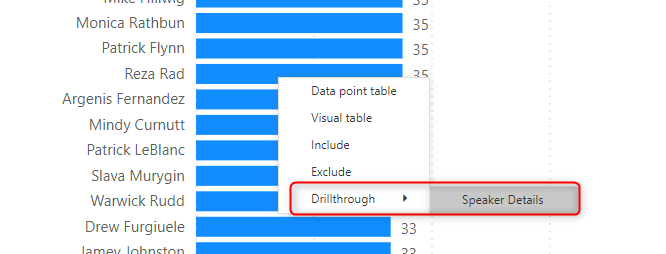
if you right-click on a speaker, you can drill through to the details of that speaker too.
and the speaker details shows the timeline of events for that speaker with some more details about the speaker:

Same process can be done for events with drill through from the events page:
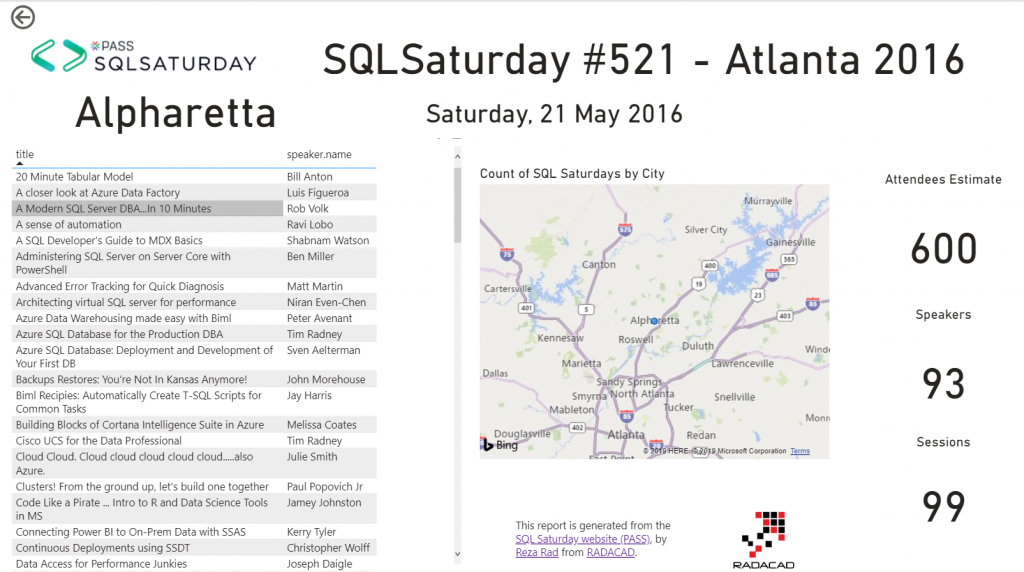
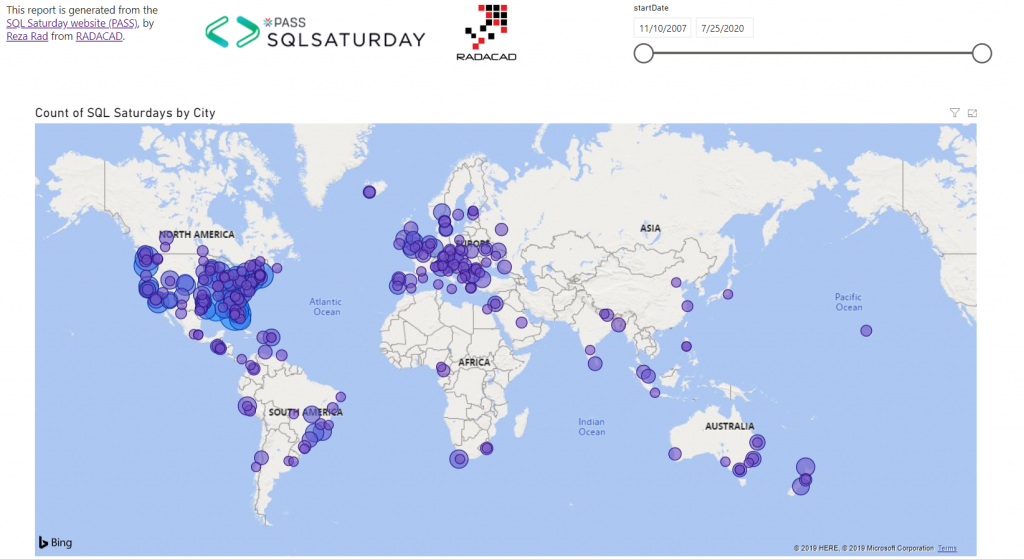
Map of all the events:
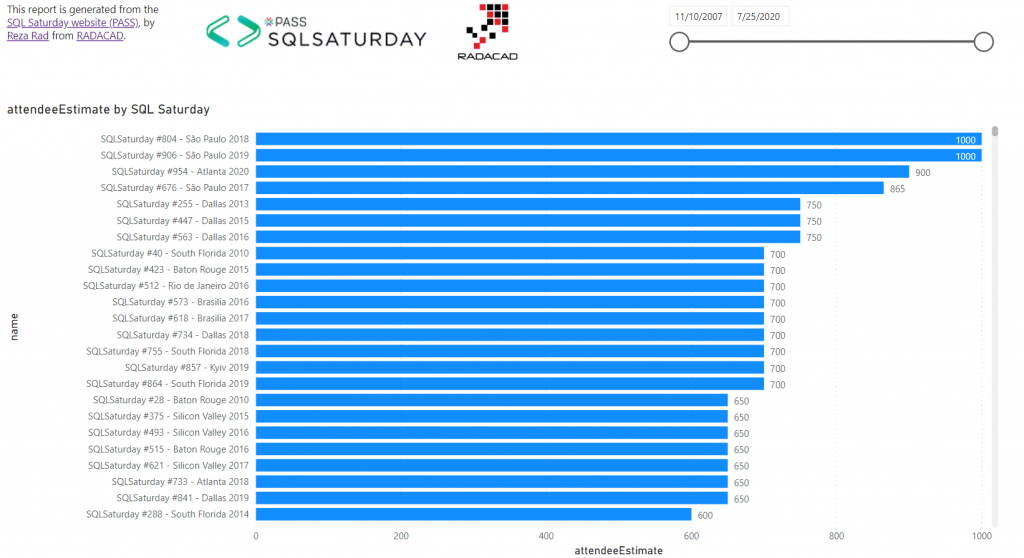
List of all events with their estimate of attendees:
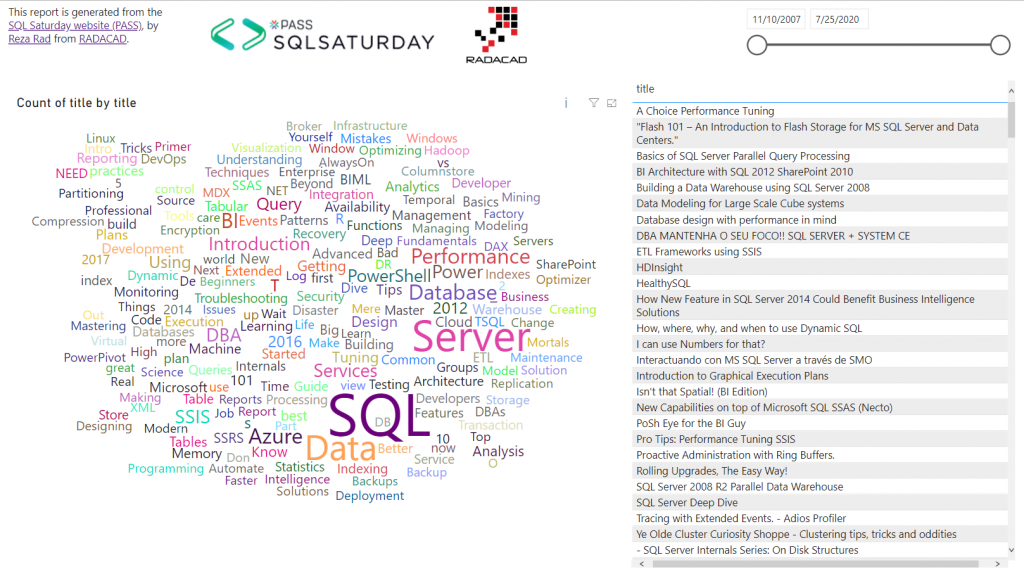
a term(text) analysis of keywords used in sessions:
and a timeline of events, speakers, and sessions:
Interesting, isn’t it?
Go ahead and check the interactive Power BI report yourself!


Reza is author of more than 14 books on Microsoft Business Intelligence, most of these books are published under Power BI category. Among these are books such as Power BI DAX Simplified, Pro Power BI Architecture, Power BI from Rookie to Rock Star, Power Query books series, Row-Level Security in Power BI and etc.
He is an International Speaker in Microsoft Ignite, Microsoft Business Applications Summit, Data Insight Summit, PASS Summit, SQL Saturday and SQL user groups. And He is a Microsoft Certified Trainer.
Reza’s passion is to help you find the best data solution, he is Data enthusiast.
His articles on different aspects of technologies, especially on MS BI, can be found on his blog: https://radacad.com/blog.
Hello rezza, Interesting dahsboard but how did you manage to donwload/retrieve all Pass.org events datasets ?
These are mainly coming from XML files of events that PASS.ORG has hosted
Cheers
Reza
Hi Reza. Really great report! Will it be online after Jan 15th when PASS is no longer available anymore?
Thanks Steve
This Power BI report is importing data from the source. if the source no longer exists, the data in the report will stay as its last snapshot 🙂
Cheers
Reza