
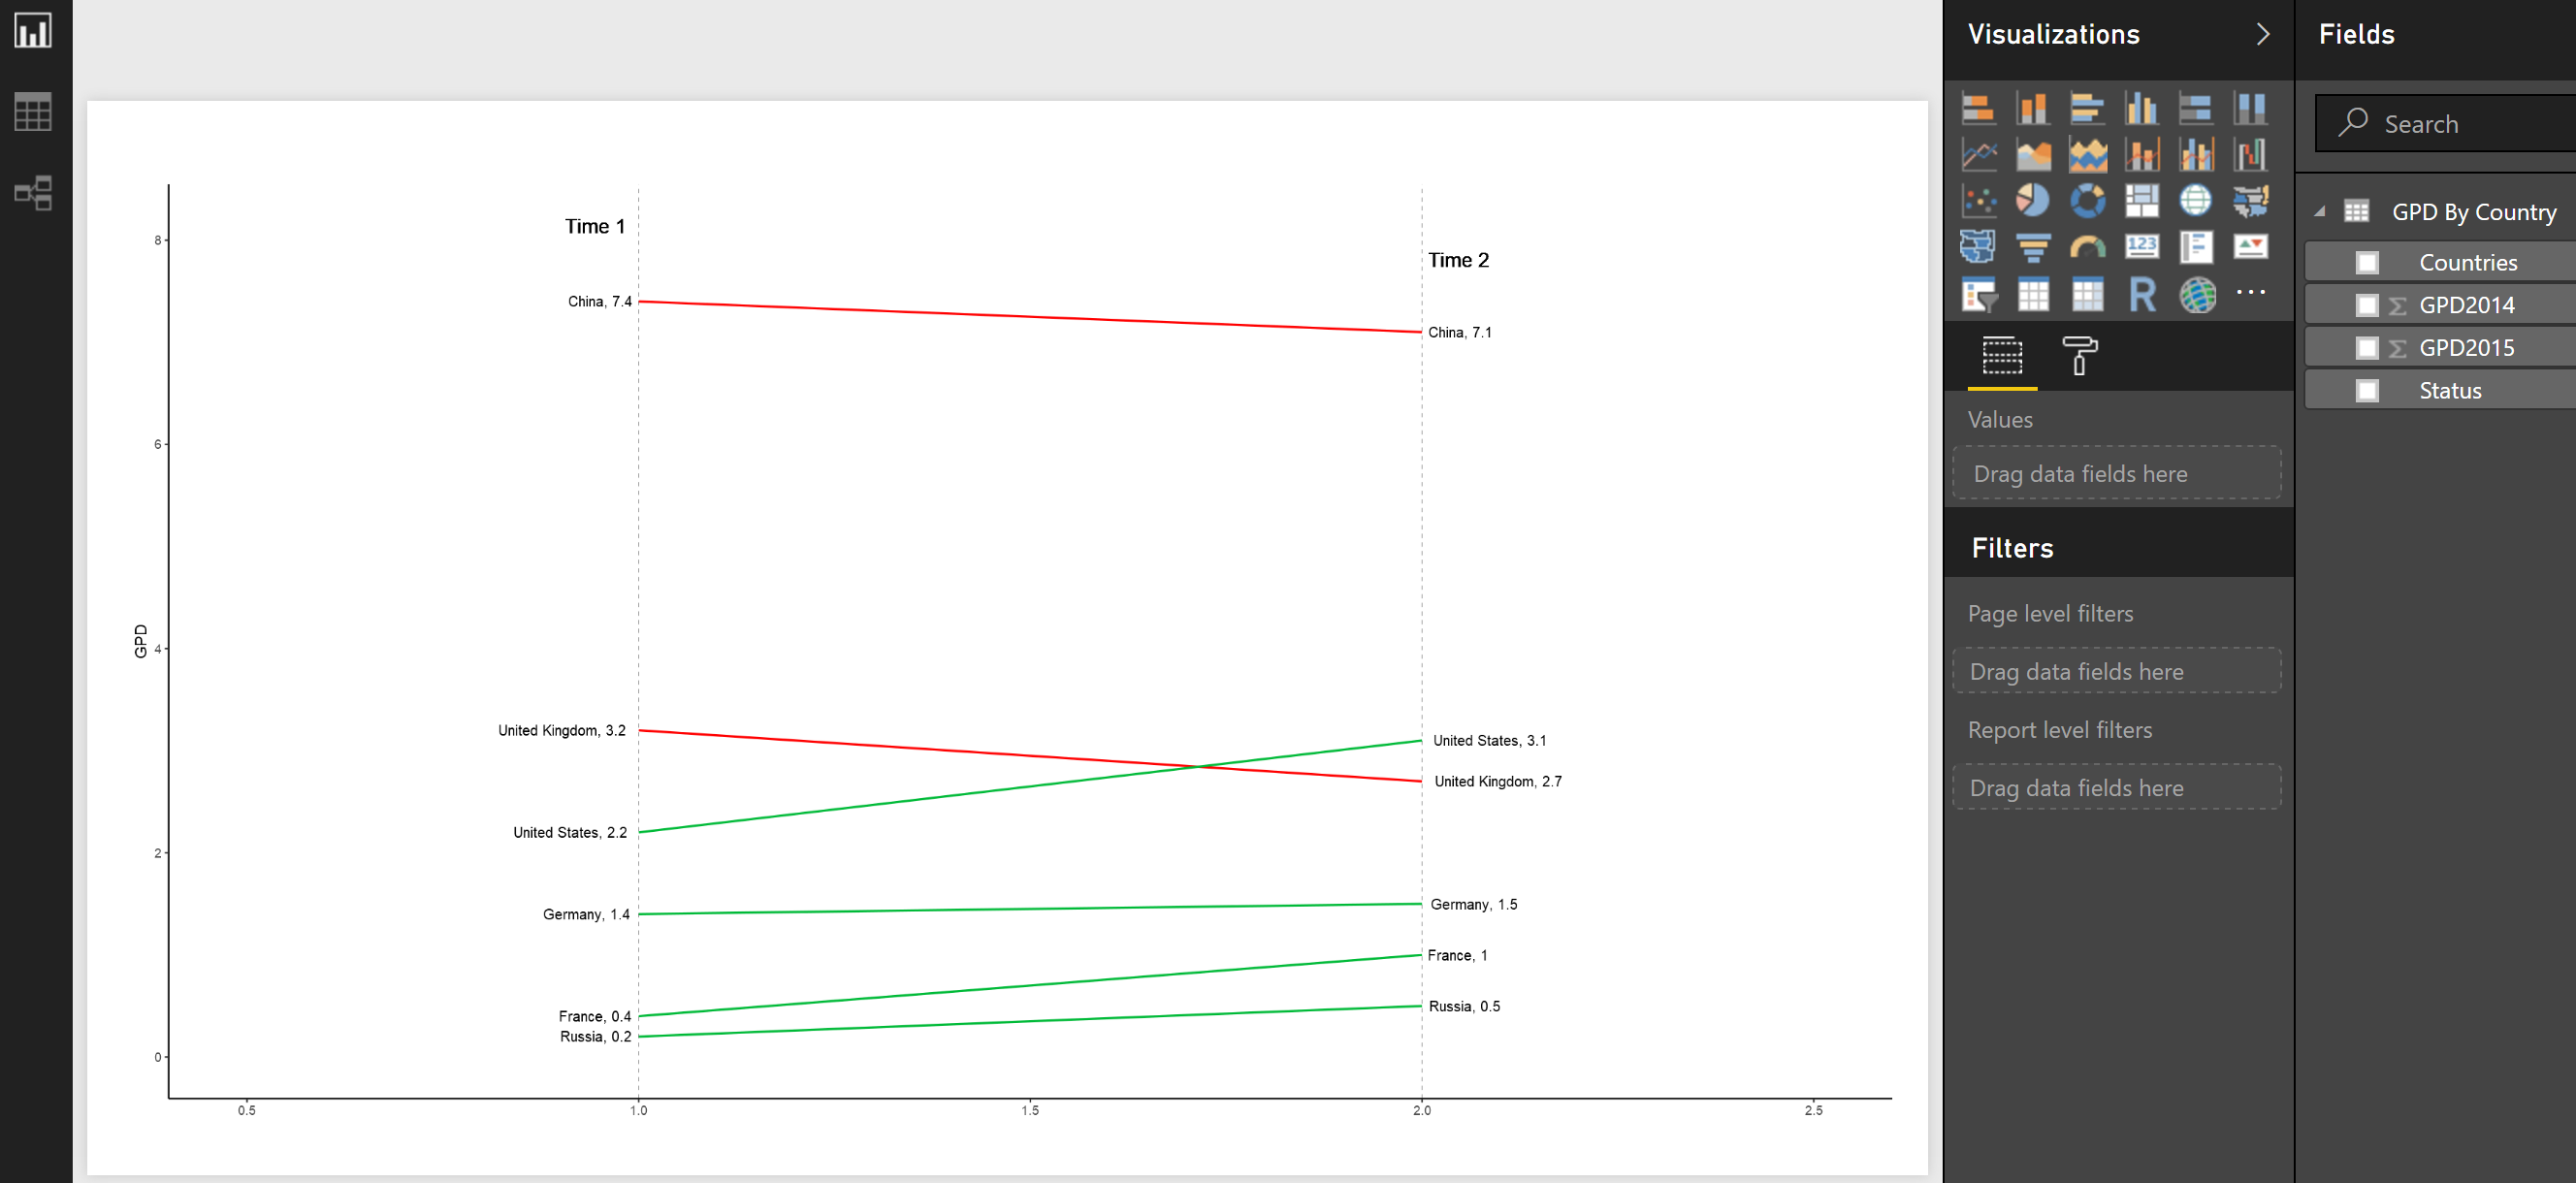
Draw Slope Chart in Power BI: Part 8
Slope chart can be used for comparing data between two different time periods. it is a very easy way to depict the difference between to time, two elements or any other two attributes. The slope charts can be used to study the correlation between variables or to study the change in the same variable between Read more about Draw Slope Chart in Power BI: Part 8[…]