

Power BI is more than Power BI Desktop. It is a combination of some components. Learning about these components and their role in the solution is important before any further steps. It is impossible to talk about architecture when you don’t know about Power Query or Power BI Service. Each component plays an important part in the Power BI solution; It is essential to know them as the first step. In this article, we will talk about the below components.
- What is Power BI?
- Power BI Desktop, Tool for Report Development
- Power Query for Data Transformation
- DAX and Modeling, the Analytical Engine
- Power BI Service for Hosting Reports
- Power BI Mobile App
- Power BI Report Server, an on-premises hosting for Power BI
- Power BI Report Builder; for building paginated reports
- On-Premises Gateway
- Dataflow
- Datamart
- Dataset
- Report
- Paginated Report
- Dashboard
- Metrics and Scorecards
- Deployment pipelines
- Workspaces
- Power BI App
- Power BI Premium
- Power BI Embedded
- Developer API
What is Power BI?
Power BI is a cloud-based technology from Microsoft for reporting and data analysis. This reporting technology is built in a way that is not only useful for developers to create reports but also for power users and business analysts. Power BI created a simple, easy-to-use, and user-friendly environment for creating reports. And on the other hand, it is based on several powerful components which help create reports and data analysis for complex scenarios.
Every component of Power BI is responsible for a specific part of the technology. There are components for building reports, connecting to data sources, doing analytics calculations, sharing reports, etc. The following sections explain what each component is. Some of these components are explained in detail in other articles.
Power BI Desktop, Tool for Report Development
The most common tool when talking about Power BI is Power BI Desktop. This tool is the report development or report authoring editor for Power BI reports. This tool is free to download, install, and use. This tool is lightweight, about ~450MB, and can be easily downloaded and installed. There is no configuration when installing this tool. Power BI Desktop supports installation only on Windows machines at the time of writing this article. There are some ways of installing it on non-windows machines such as Mac using some utility tools, but that topic is outside this article’s scope.
Below image is a screenshot of Power BI Desktop at the time of writing this article;
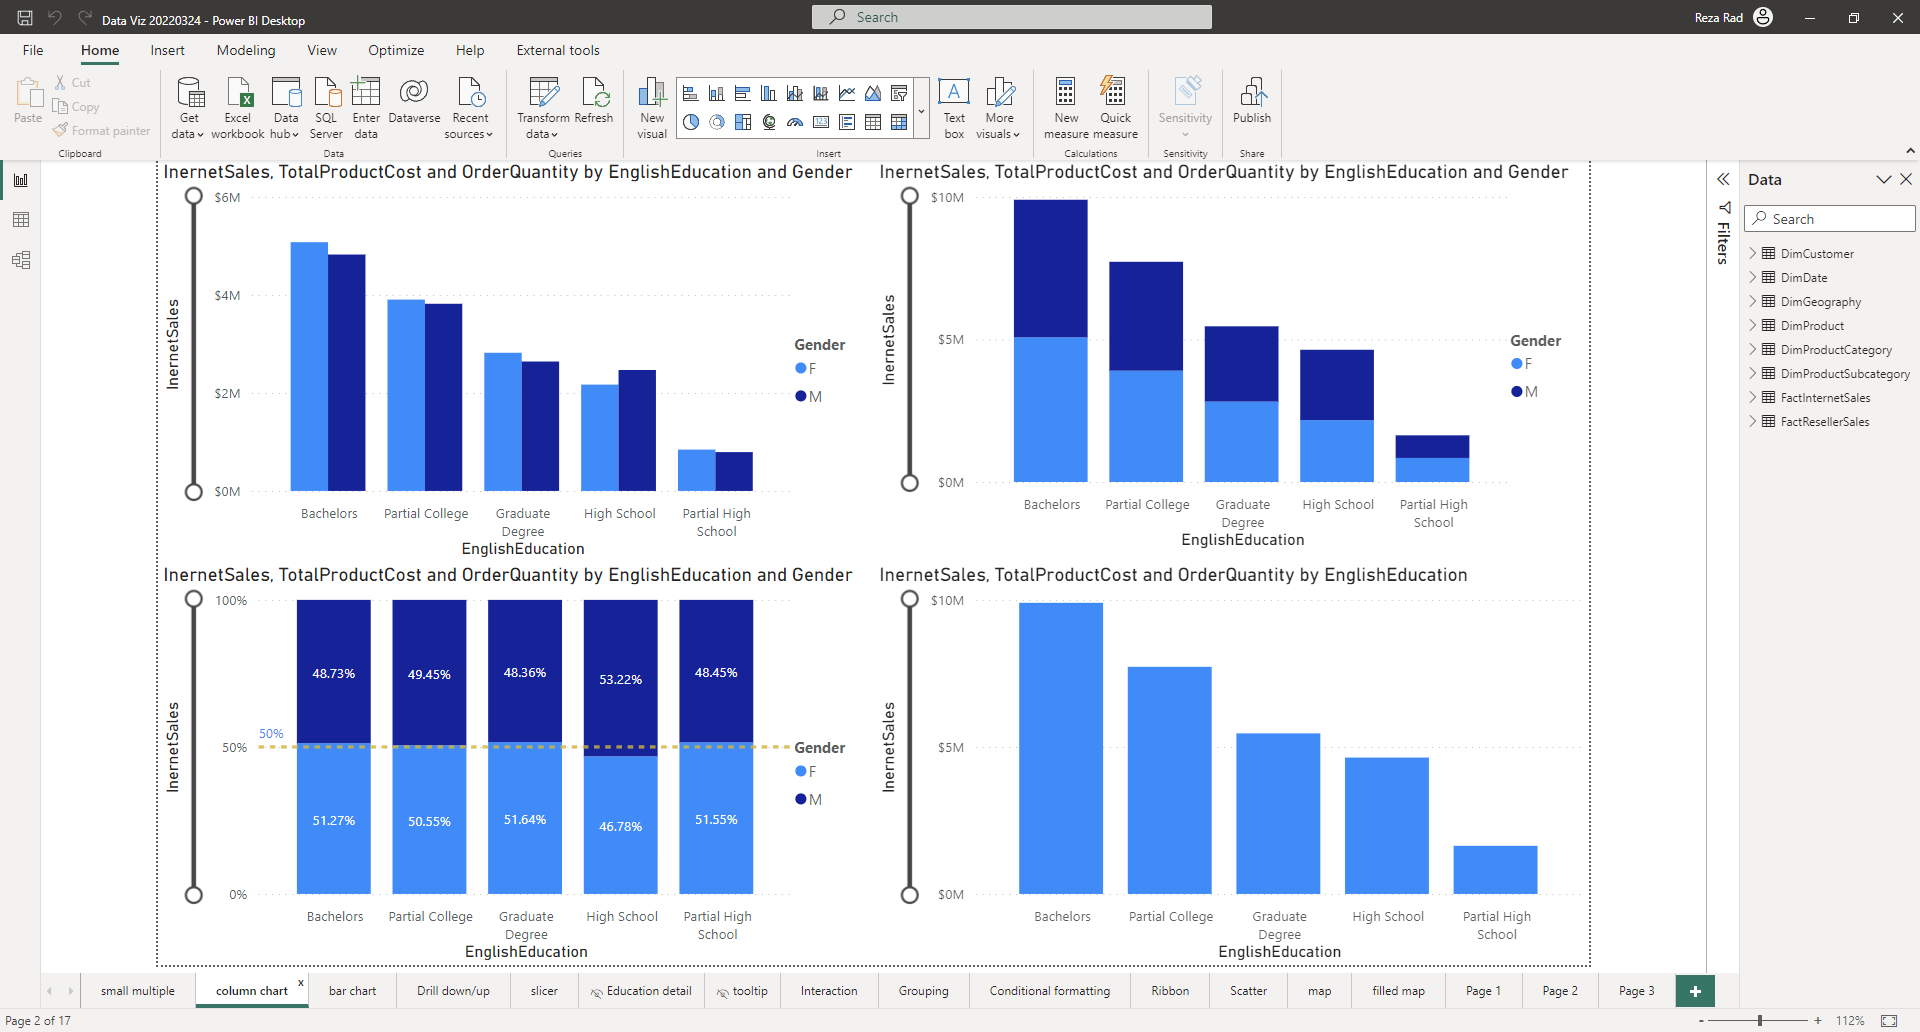
Power BI Desktop is not a complex tool to build your first report. Although most of the report development these days uses Power BI Desktop, The Power BI team is enabling the Power BI Service user interface to provide the same functionality. This means that without the installation of a tool and on any operating system, users would be able to build Power BI reports in the future.
Power Query for Data Transformation
As one of the key components of every reporting tool is connecting to data sources and preparing data (or data transformation), there is a specific component in Power BI; named Power Query. Power Query is also called Get Data and Transform. Power Query is the component that connects to different types of data sources, gets data from those, gives you the ability to apply transformations, and finally loads the data into your Power BI data set.
Power Query comes in different shapes and sizes. It is not just within Power BI Desktop. You can even find it in Excel. This component is part of Power BI Desktop also. It means when you install Power BI Desktop; Power Query is automatically installed. You can start working with that by choosing Get Data from Power BI;
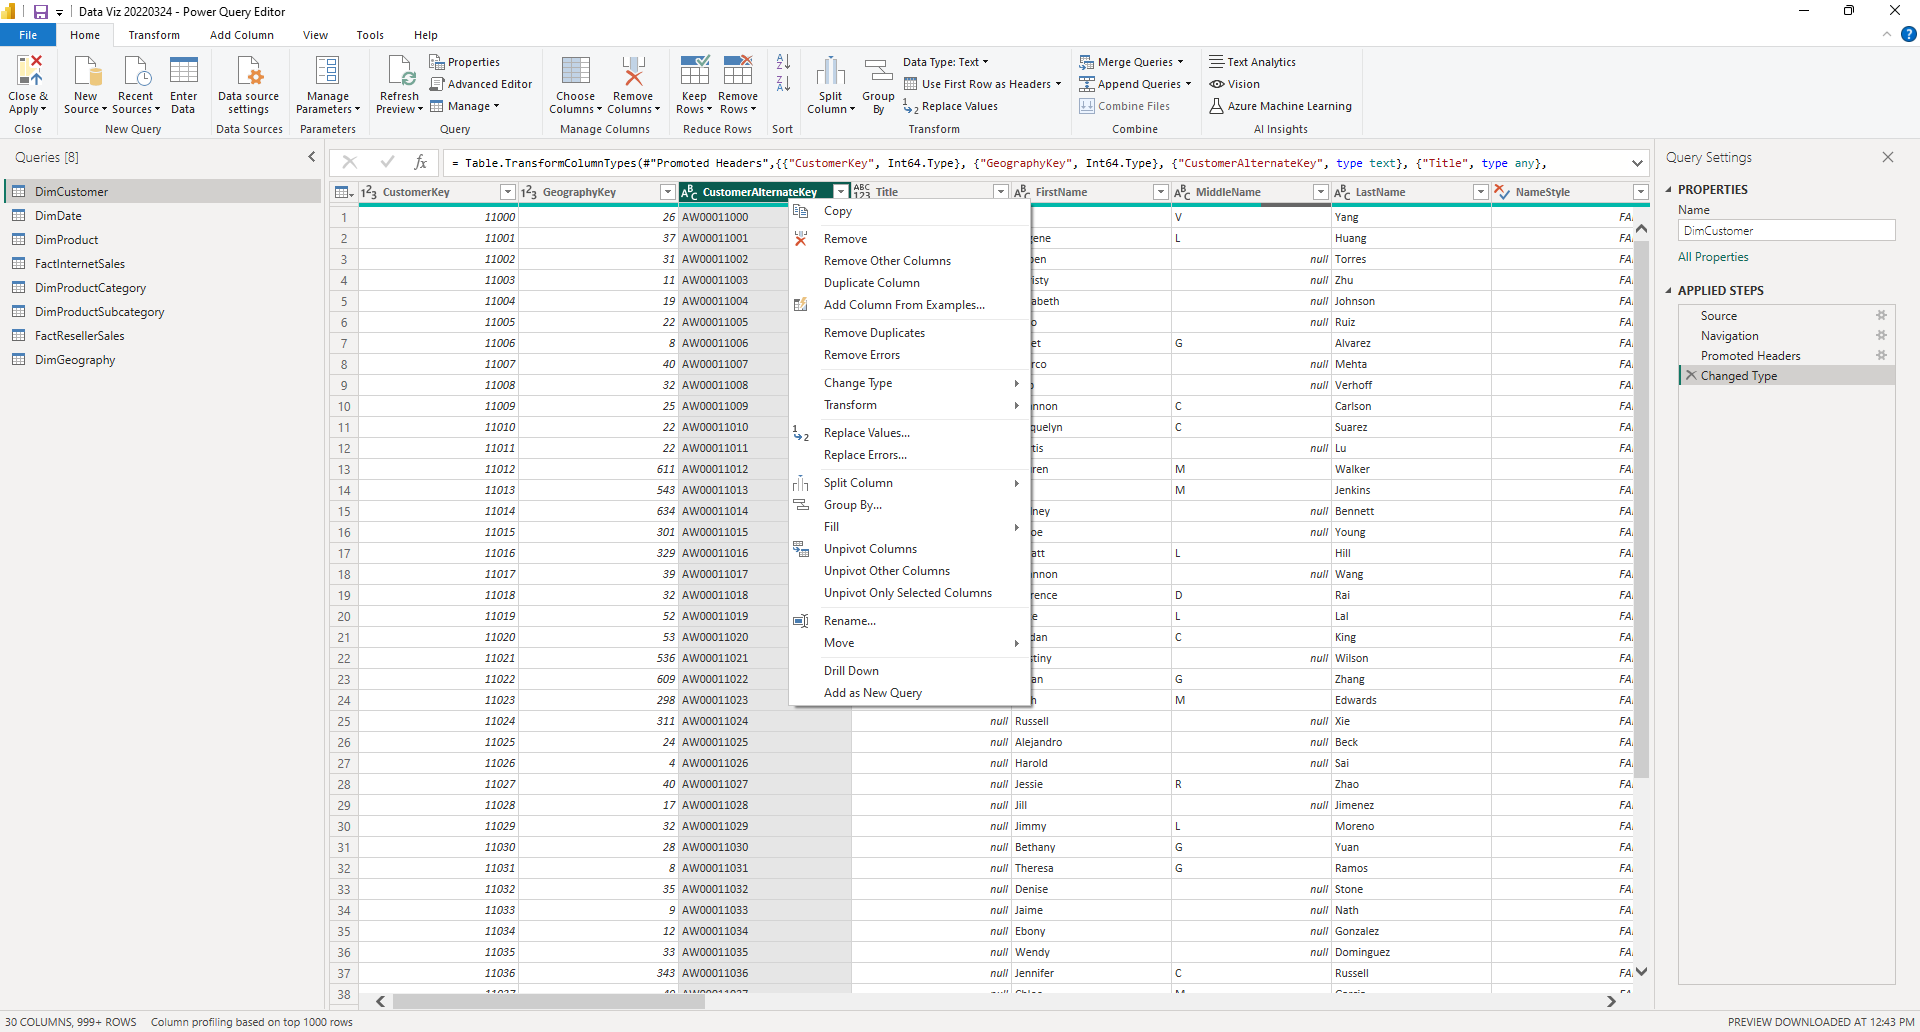
There are many data sources that you can get data from them with Power Query. You can even create connectors yourself. Power Query has a window for development called Power Query Editor. Power Query Editor is the place where you apply all data transformations, and it prepares data to load into Power BI. This process usually happens before data loads into Power BI.
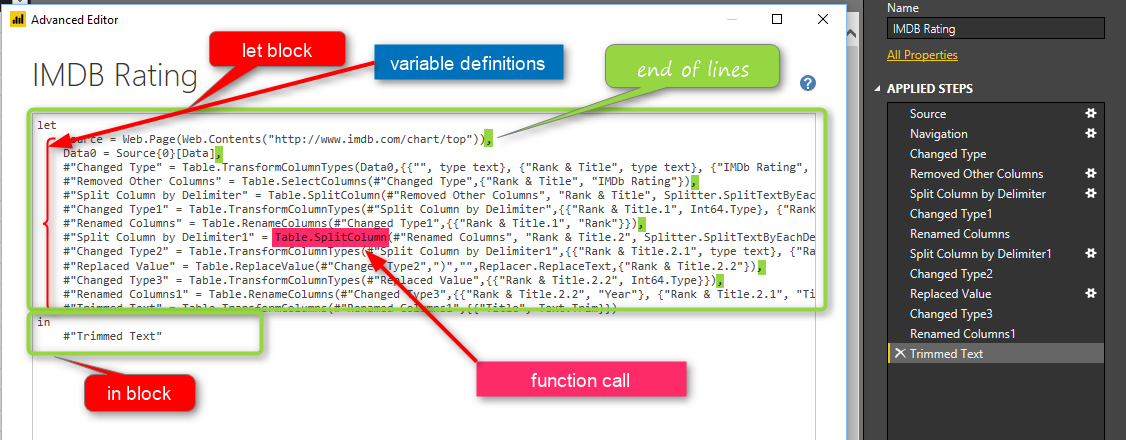
Power Query uses a functional language called M. M is the behind-the-scene language for the data transformation in Power BI.
Report
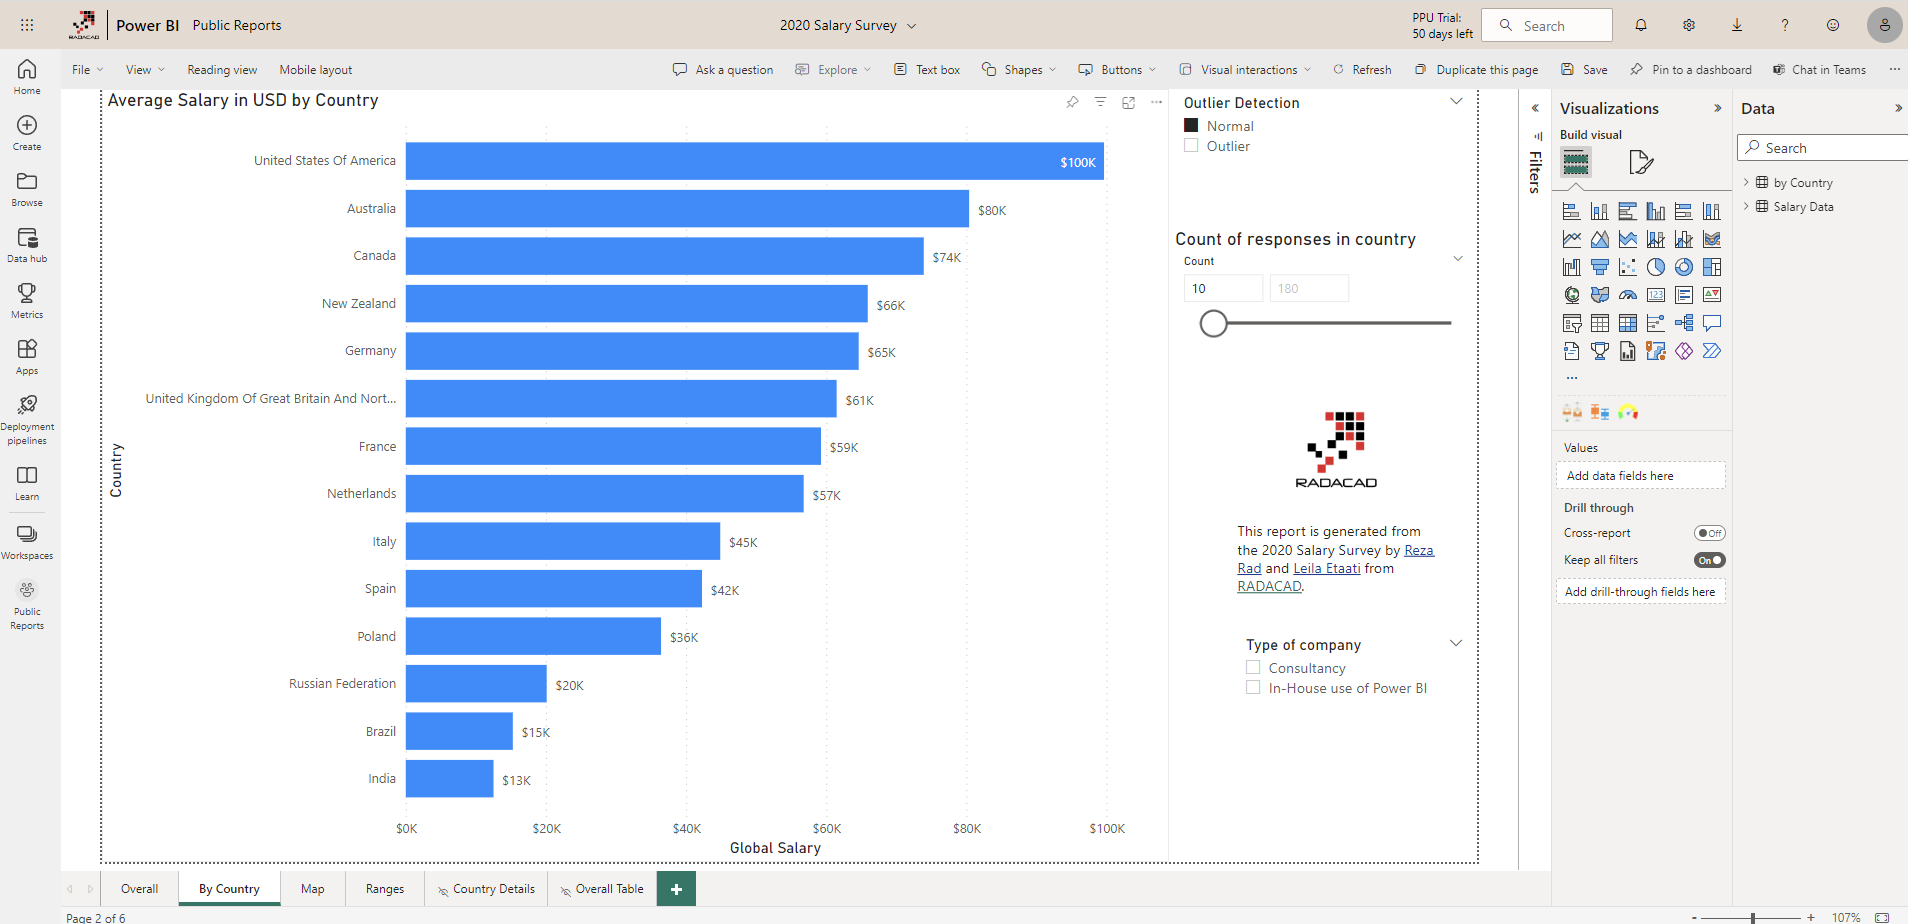
Power BI Report is the visualization layout of the Power BI. The Power BI report is an interactive set of visualizations across multiple pages. This visualization allows the end-user to slice and dice the data. The Power BI report is either designed in the Power BI Desktop or through the Power BI Service.
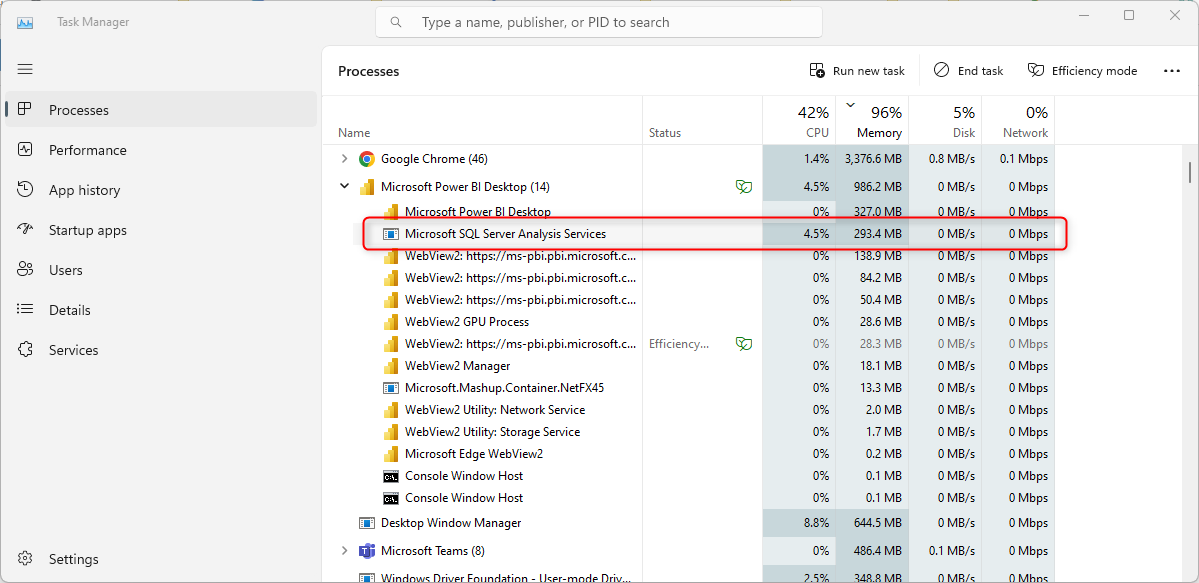
Analytical Engine (Tabular Engine)
This component is the analytical core and engine of the Power BI data model. The Tabular engine installs as part of Power BI Desktop, with no specific editor window. All modeling, calculations, and configurations will be in the Power BI Desktop window. DAX and Modeling are builtin within Power BI Desktop in a way that most people consider as the non-detachable part of Power BI Desktop. However, the data model component of Power BI is a separate object called a Dataset.
Power BI Analytical engine is similar to the SQL Server Analysis Services Tabular or Azure Analysis Services. However, depending on the licensing you use for Power BI, there might be differences between those two services.
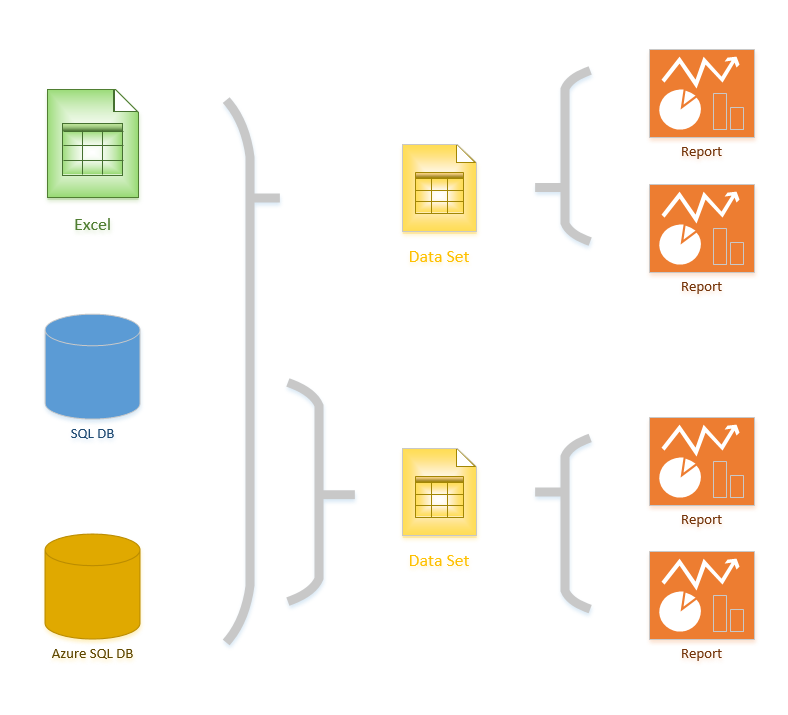
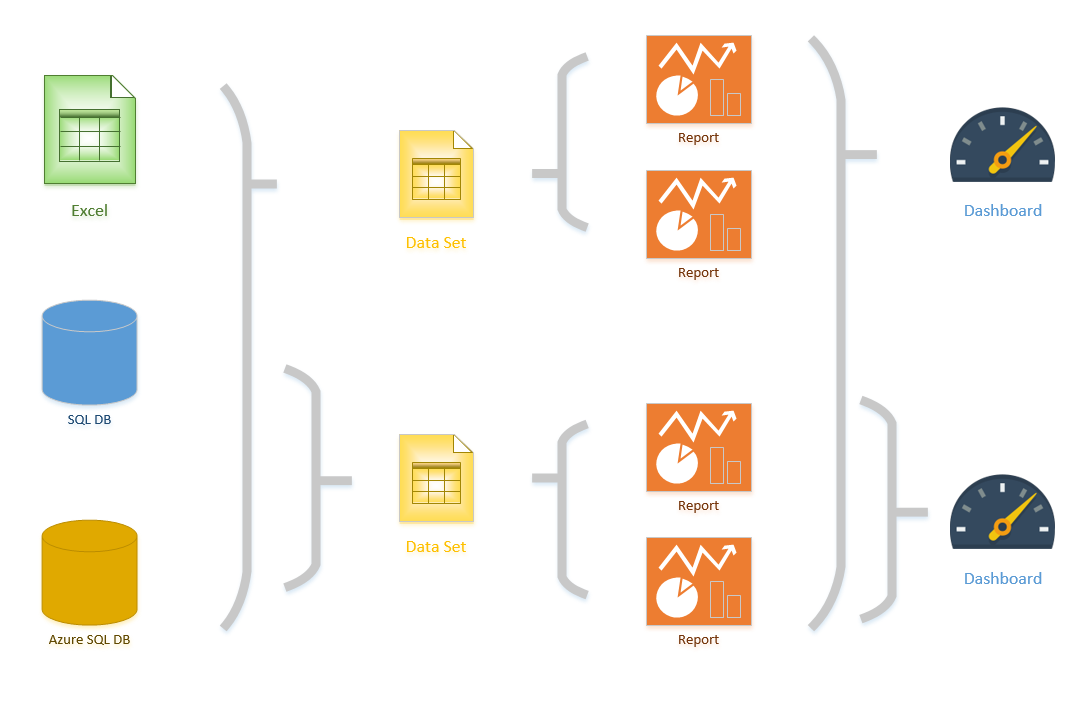
Dataset
A Dataset in the Power BI environment is where all the data, the relationships, connections to the data source, the DAX calculations, and the field or table-level configuration lives. The report is then connected live to this dataset to produce visualizations. Multiple reports can be created from the same dataset, bringing the concept of a Shared Dataset.
There are different types of Datasets depending on how the connection to the data source is created. Sometimes a Dataset uses a DirectQuery connection. Sometimes, it might be a Dataset with data imported from data sources. Sometimes, a dataset is a DirectQuerry connection to other datasets. A dataset can even be a real-time streaming dataset.
Dashboard
Although the report is the core of visualization in the Power BI environment, the Dashboard can sometimes be used to provide a holistic view across multiple reports. A dashboard in a Power BI environment is a visualization element that is not interactive (unlike the report). It is designed to provide a single view out of multiple reports for the end user. It also comes with features such as Data-driven alerts and real-time tiles, and auto-refresh.
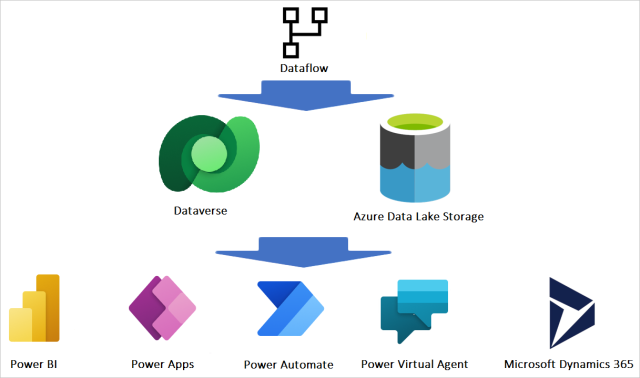
Dataflow
The data transformation layer of Power BI can be separated from the dataset so that it has its repository. This would enable multiple datasets to use the tables generated using Power Query. The component and engine that provides such a feature are called Dataflow. Dataflow exists in Power BI as a service-only component. The data for the tables will be stored in Azure Data Lake Storage (other storage options will be available in the future, such as Azure SQL Database). Dataflow will enable the Power BI developer to separate the data transformation layer of the Power BI implementation from the rest of the model and, as a result, have a more reusable solution.
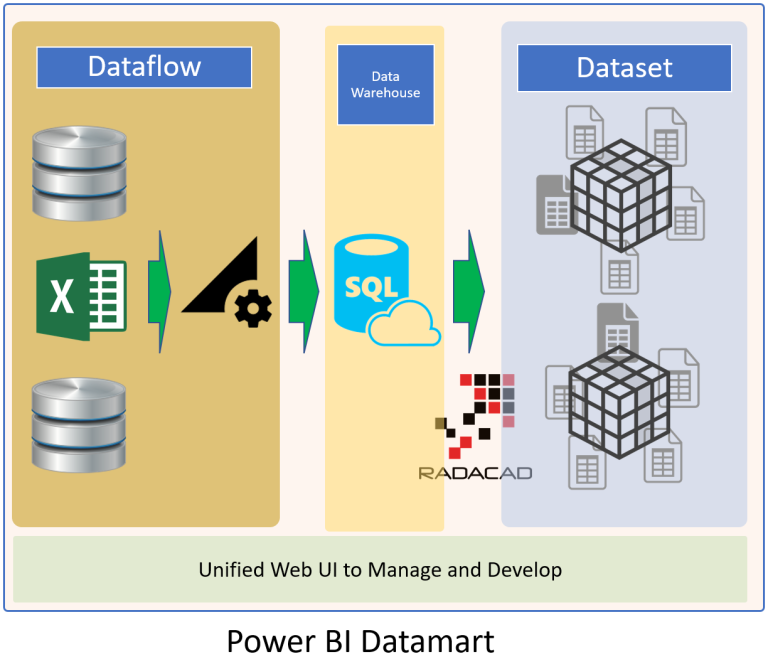
Datamart
Datamarts simplifies the creation of multiple components of Power BI through one unified editor. Using a Datamart, you can have the Dataflow, a central repository of the data based on Azure SQL Database, and the Dataset through one object. Datamarts can be created through the Power BI Service. Datamarts are one of the most recent additions to the Power BI components.
DAX
DAX is the data analytical language in Power BI. DAX is not just part of Power BI. It is also part of Excel Power Pivot, SQL Server Analysis Services Tabular Model, and Azure Analysis Services. DAX is a language that has a steep and long learning curve. Some consider DAX the hardest part of learning about Power BI. However, the most important part of learning about Power BI is its data modeling.
Below is a screenshot of writing a calculation in DAX. Don’t worry if you don’t understand what this DAX expression does.
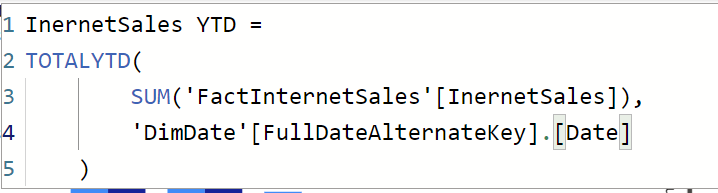
DAX stands for Data Analysis Expression language. It is a language to write calculations in Power BI. This language is very powerful and gives you much analytical power through your model.
Power BI Service for Hosting Reports
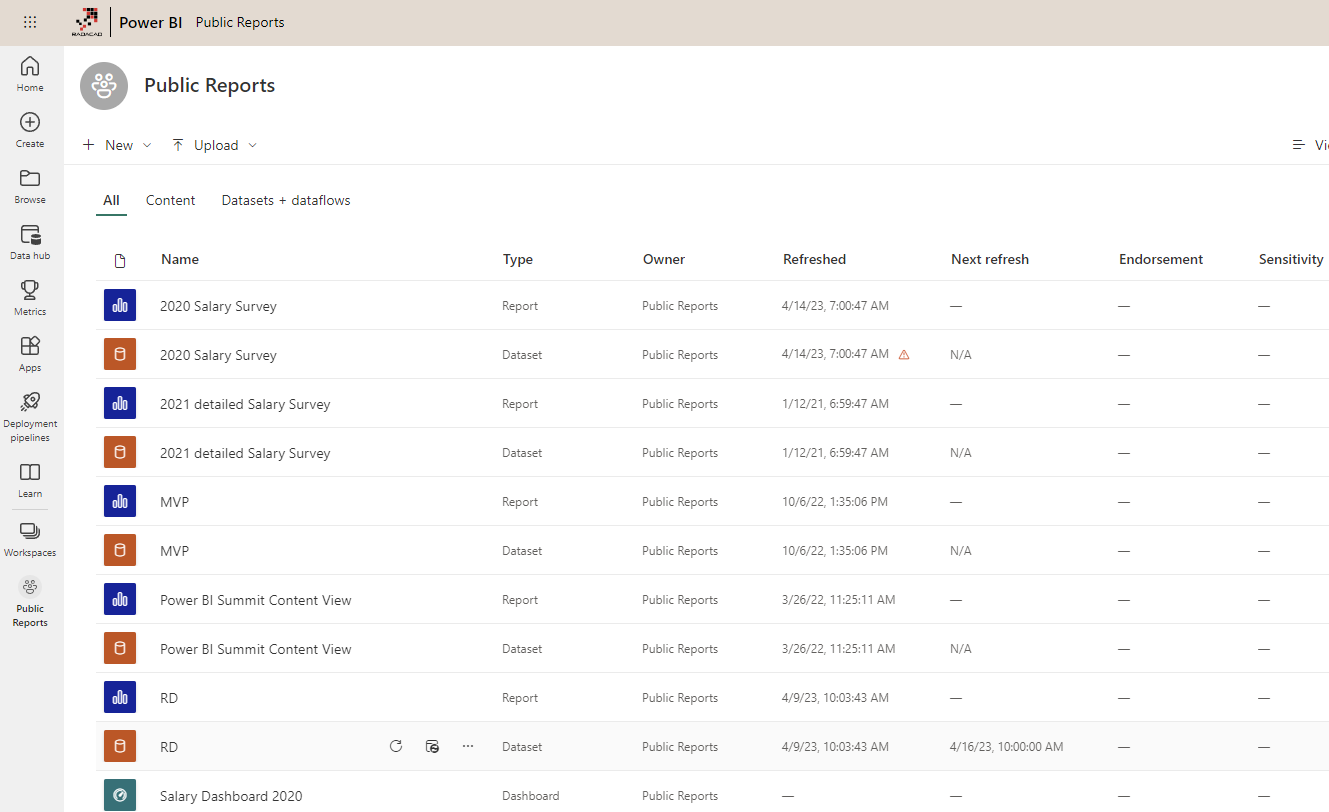
Power BI Desktop, Power Query, and DAX are all components for creating and developing reports. After developing reports, it’s time to publish them and share them with others. Power BI Service is an online service hosted on the Power BI website for hosting reports and sharing them afterward. You must have a Power BI account to work with Power BI Service. There are a few options when choosing an account; you can learn about that in full detail later in the licensing article.
Your reports, after publishing to the website, will be accessible via the Power BI service (or website) through https://app.powerbi.com/
You can even edit, or author reports in the Power BI service. However, not all the Power BI Desktop development functionality is still available on the service.
Power BI service can be accessed via different browsers if you use their recent versions. Power BI service works based on the HTML5 standard, which is supported in all new browsers; IE, Edge, Safari, Chrome, Firefox, etc.
Power BI Mobile App
Besides using browsers to connect to Power BI service and browse reports, there is another way to access reports interactively. A Power BI mobile app is available in the Windows Store or Microsoft, the App Store of Apple, or the Google Play store. The app is free; you can easily download and install it. After logging in to the app, you can browse Power BI reports from your mobile devices. Mobile reports can be designed to be different from normal reports. The image below is a screenshot of a Power BI report opened in a mobile app;
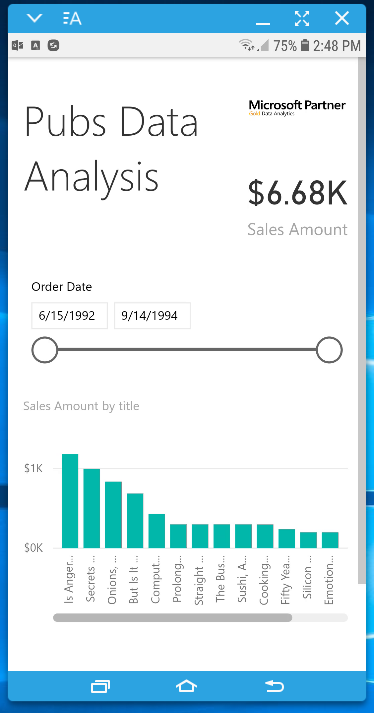
Having the report in the mobile app will give you some specific features, such as annotation and sharing the annotation with others.
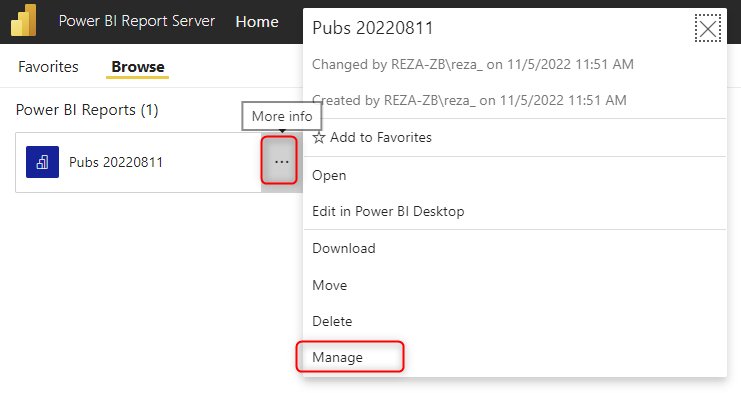
Power BI Report Server, an on-premises hosting for Power BI
Many businesses still prefer to keep their solutions and data on-premises. Power BI is a cloud-based technology. However, it has a version that works on-premises. This edition of Power BI keeps the report, data, and everything on-premises if required. Power BI on-premises leverages a component named Power BI Report Server.
Power BI Report Server is a specific version of SQL Server Reporting Services developed for hosting Power BI reports. Reports are shared with other users through this environment. There are a lot of features in the Power BI service, which not yet been implemented on the report server. However, this solution gets users to the on-premises experience of Power BI reports. This article goes through the Power BI report server in detail, and you will learn about the installation, configuration, and using the report server.
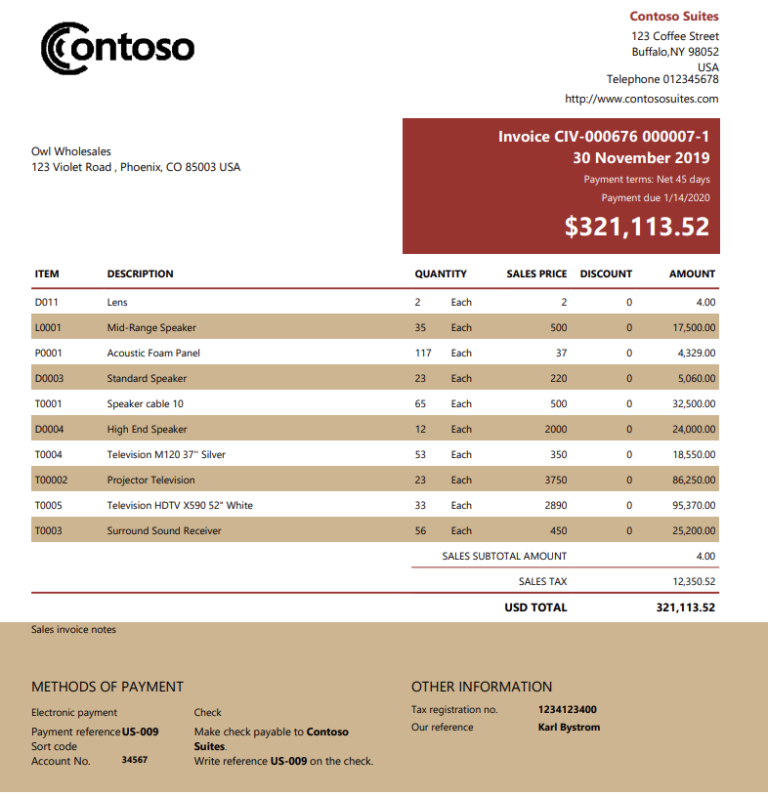
Paginated Reports
If there is a need for a Power BI reports to be printed, then it is better to design a different kind of report called a Power BI Paginated Report. Power BI Paginated report has major differences from normal Power BI report; one of the is that the Pagianted Report is not as interactive and easy-to-use and easy-to-build as the Power BI report. On the other hand, the Paginated Report can be designed for fine-printing details, whereas the normal Power BI report can’t. Paginated reports cannot be developed by the Power BI Desktop. It has to be developed using a different tool, Power BI Report Builder.
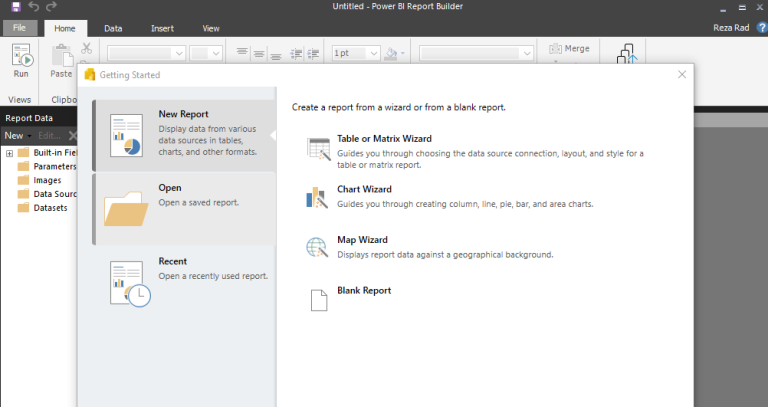
Power BI Report Builder
Power BI Report Builder is the tool to create Pagianted Reports. This tool can be installed on a Windows machine. This is a tool that is inherited from SQL Server Reporting Services Report Builder. Power BI Paginated reports are descendants of Reporting Services reports and have an RDL extension.
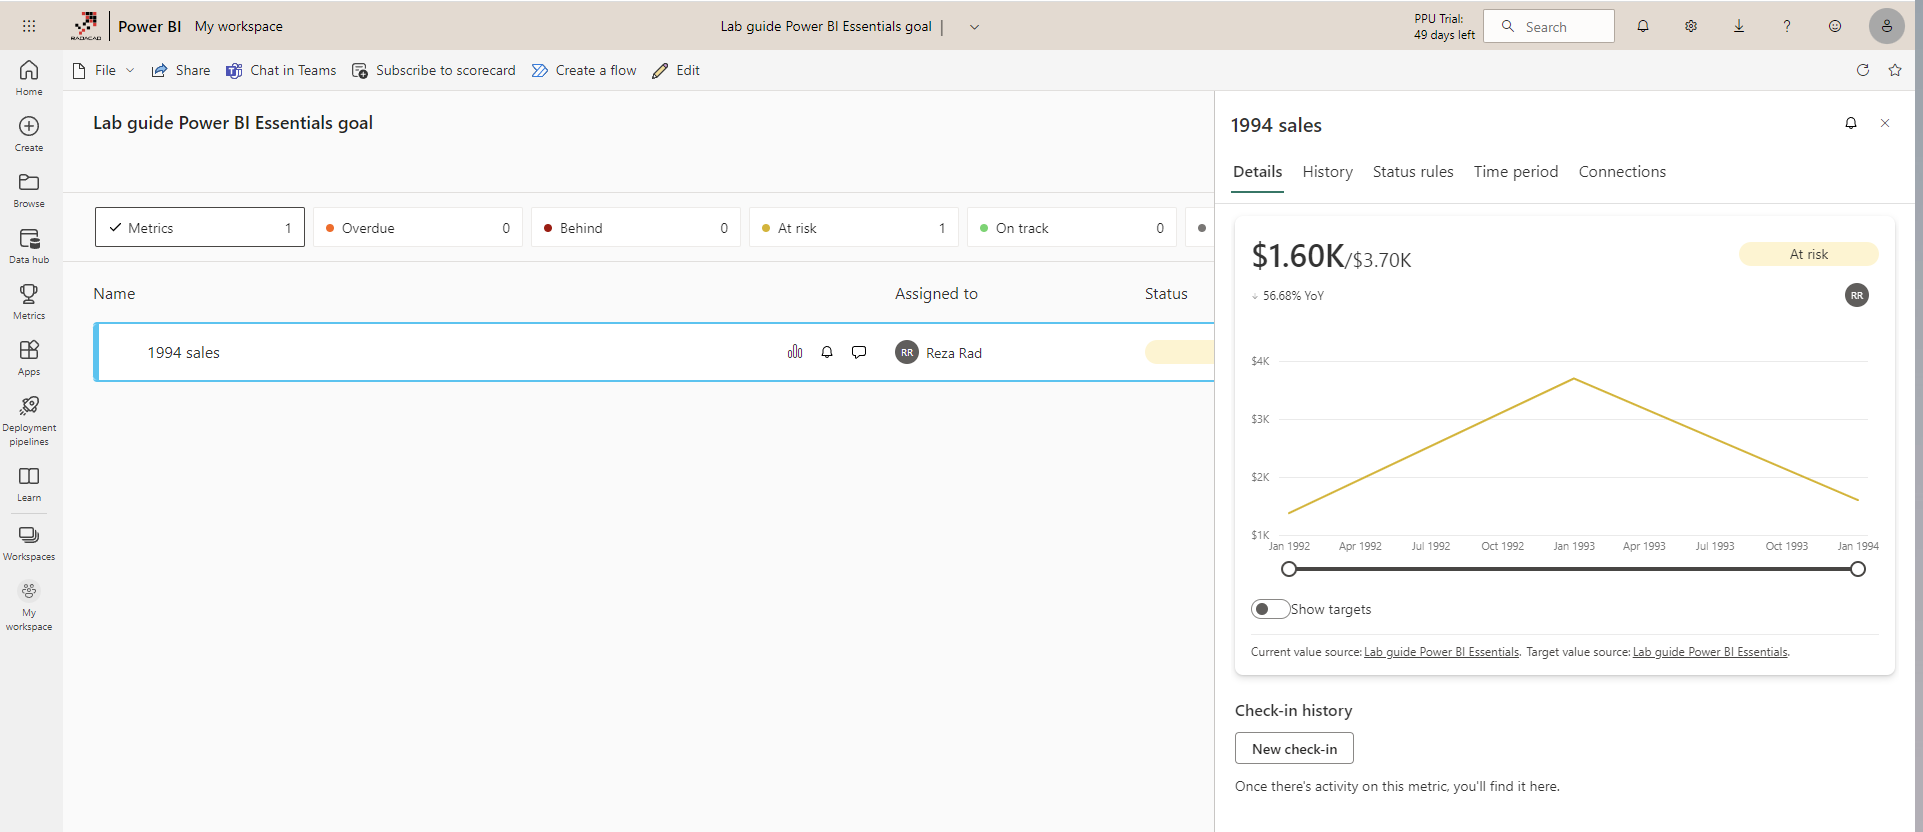
Metrics and Scorecards
In every business, key performance indicators need to be measured often, and based on their results compared to targets, you can tell if the business is acting on track, behind schedule, or in other statuses. In the Power BI environment, the component to create these is called Metrics. You can create Power BI Metrics with Scorecards getting their values from a Power BI Dataset. Rules and status identifiers can be defined on the scorecard items to automatically track the KPI’s current status. Metrics and Scorecards must be created in the Power BI service, but they can be embedded into a Power BI report using the Power BI Desktop. Power BI Metrics previously was called Power BI Goals.
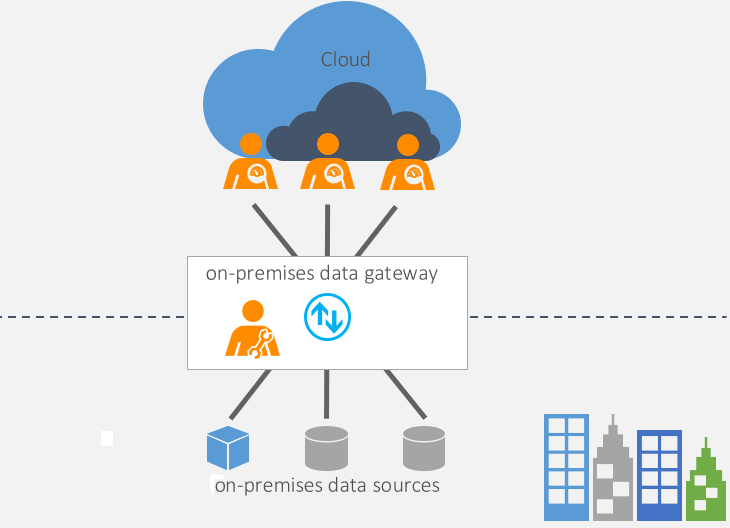
On-Premises Gateway
On-premises Gateway is another component of Power BI specifically for creating a connection between Power BI service (a cloud-based technology) and the data source on-premises. This component is an application that installs on a server on the on-premises domain and manages the connection for Power BI reports. Gateway is unnecessary if the data source is cloud-based (such as Azure SQL Database).
Gateway installation has some options and configurations which need careful consideration. This article will go through the details of installing a gateway, configuring it, adding data sources to it, and finally, scheduling data sets to be refreshed through a gateway connection.
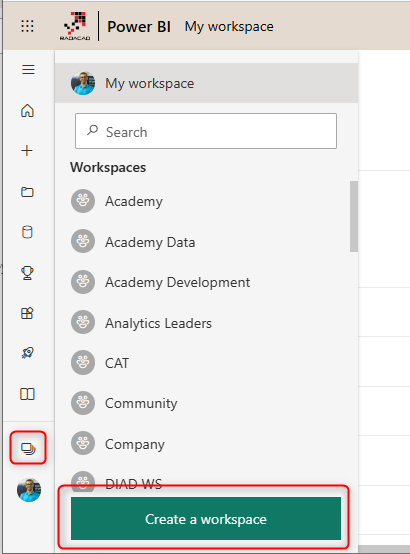
Workspaces
In the Power BI Service, objects are placed inside workspaces. Workspaces can have multiple Power BI objects (reports, paginated reports, dashboards, datasets, dataflows, datamarts, etc.). Workspaces are the core of deployment and sharing in the Power BI service environment. The access level can be defined on the workspace itself. And the end-users can consume the content of a workspace through Power BI Apps.
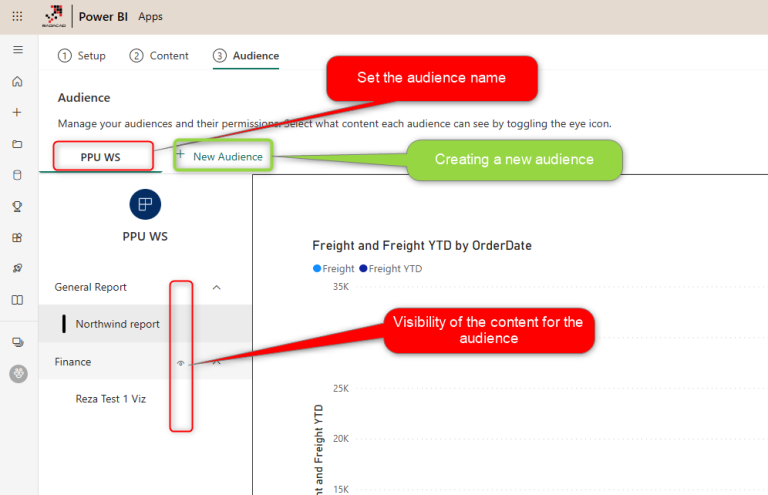
Power BI App
Although the workspace’s content can be shared directly with the end user, creating a separate environment for the user is better. In the user environment, you can also have custom navigation to make it easier for the end users to consume reports. Power BI has a component that offers these features, called Power BI App. Power BI App differs from the Mobile App for Power BI. Power BI is a method of sharing content with the end-users.
Power BI Premium
Power BI Licensing comes with a variety of options. The most comprehensive license for Power BI is called Power BI Premium. This license provides full functionality throughout all the components of Power BI. It also provides a dedicated capacity through the Power BI Service, which can be used for enhancing the performance of reports and datasets. Power BI Premium comes in various nodes, each with different specifications for the dedicated capacity.
Power BI Embedded
If there is a requirement that the Power BI report be embedded in a custom web application in a way that the users of that custom application can use the Power BI report, it is possible. Power BI Embedded provides the functionality to embed the Power BI reports inside a web application. Power BI Embedded works with a licensing plan. There is a need for a web developer to embed the Power BI content inside the web application and manage the authentication and authorization.
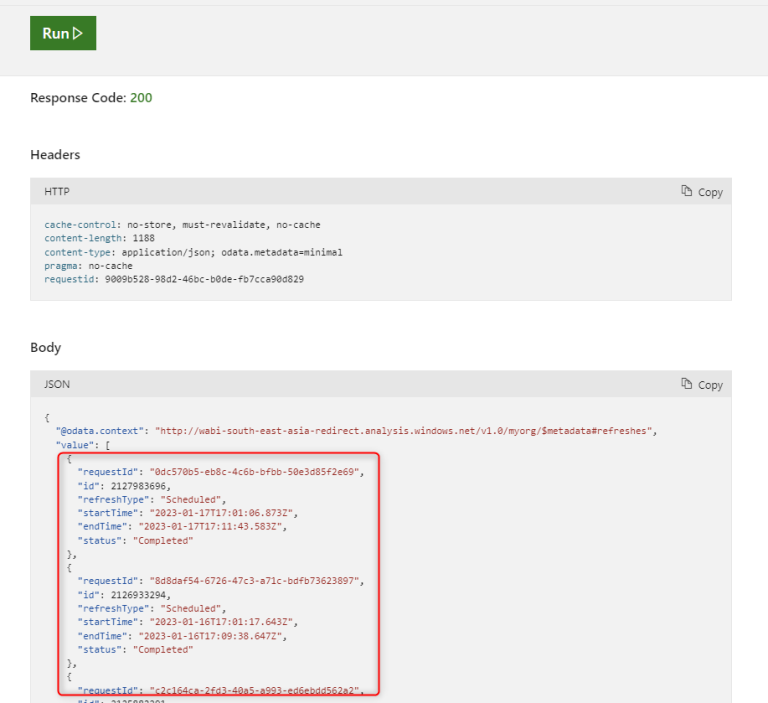
Developer API or REST API
Power BI is not just a tool for report developers; it is also for application developers or programmers. There are few APIs in Power BI that developers can interact with it. REST API is an API for .NET (C#, or VB), and developers can use it through ASP.NET or Mobile applications. This API lets you interact with the report in the Power BI service. You can embed a report into an application, refresh the data set in the Power BI service, change gateway configuration, etc. Learn about the REST API of Power BI here.
There are also other SDKs that developers can work with that. An SDK for creating custom connectors in Visual Studio or another for creating custom visuals.
Summary
It is important to know some of the components of Power BI before developing any solutions with it. In this article, some of those concepts are explained very briefly. There are still many terminologies that are not included here. A Power BI Architect, Developer, or even data analyst should be familiar with these components to choose whether to use them or not.


Reza is author of more than 14 books on Microsoft Business Intelligence, most of these books are published under Power BI category. Among these are books such as Power BI DAX Simplified, Pro Power BI Architecture, Power BI from Rookie to Rock Star, Power Query books series, Row-Level Security in Power BI and etc.
He is an International Speaker in Microsoft Ignite, Microsoft Business Applications Summit, Data Insight Summit, PASS Summit, SQL Saturday and SQL user groups. And He is a Microsoft Certified Trainer.
Reza’s passion is to help you find the best data solution, he is Data enthusiast.
His articles on different aspects of technologies, especially on MS BI, can be found on his blog: https://radacad.com/blog.