

In the last post, I have explained how to work with Q&A visual .
There is a way to define terms for the Q&N visual.
There are two main terms
Adjective
Define an explanation for a column using a Measure. We able to define a measure as adjective for each columns of data.
Columns
Define a new name for a column such as Branch for the region and country.
In this example, I use the same datasets for the previous post as Customer feedback.
I am going to ask a question as
show me the great customer
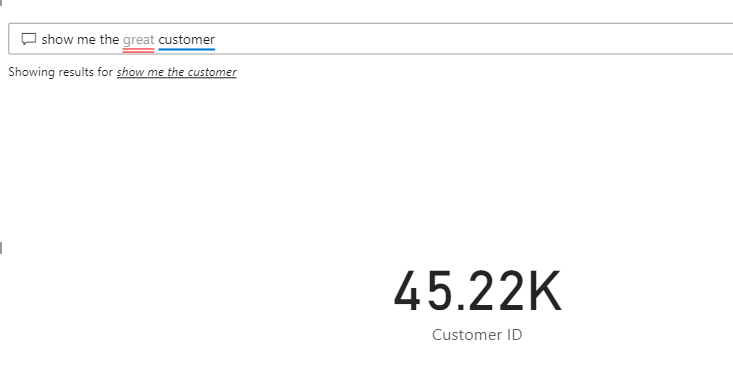
As you can see in the above picture, the Great is not defined in the dataset, it has been shown in red color. That means it does not define before it. so we need to provide a definition for the Great.
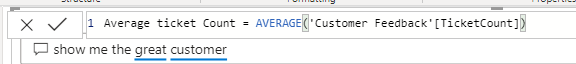
Before that, you need to define a measure that can explain the great adjective. The adjective is about the average of ticket counts a customer issued.
Average ticket Count = AVERAGE(‘Customer Feedback'[TicketCount])
Click on the setting to navigate to the Q&A visual setting.

Then click on the Teach Q&A, then click on submit to define the great value.
Great mean the customer who has less ticket count on average than two, as you can see in the above picture.
The save it.
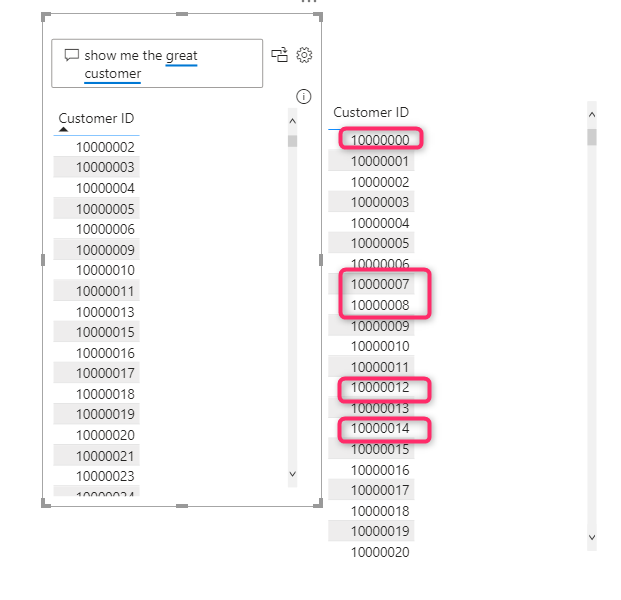
In the above picture, you can see the great is not anymore red, it is in blue color. and some of the customer ID is not on the list. That means it is already defined.
In the next post, I will explain how to define terms as synonyms, and how to manage it in the Q&A setting.


