Loop Through On-Premises Files with Power BI and Schedule it to Refresh Automatically
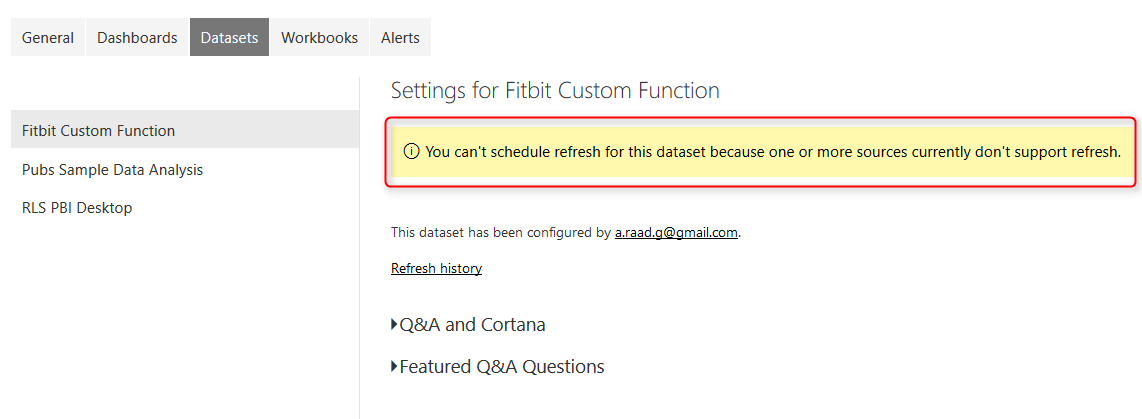
Previously I’ve explained a method of looping through number of files in a folder which used Custom Functions. This method is preferred method buy not always working with Schedule Refresh and gateway setup, because scheduled refresh doesn’t always support custom functions in the code. So I this post I show you a second method that Read more about Loop Through On-Premises Files with Power BI and Schedule it to Refresh Automatically[…]