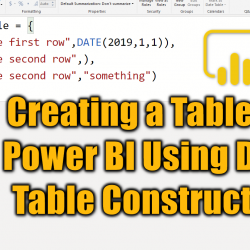
Find the Best, Worst, and Middle Values Using Simple Clustering with Power BI Scatter Chart

Machine Learning and AI can be advanced areas, however, there are some easy to use methods for that especially in the Power Platform and Power BI. Leila has written tons of blog articles about AI in Power Platform. However, as a visualization point of view, I want to show you a feature that you might Read more about Find the Best, Worst, and Middle Values Using Simple Clustering with Power BI Scatter Chart[…]

What Fields to Hide in Your Power BI Solution?

To tidy up your Power BI solution, there are some options, and one of them is hiding fields from the report view. This option, although simple, has a significant impact on making your Power BI solution very tidy and clean and easier to maintain. However, you might wonder what are fields that have to be Read more about What Fields to Hide in Your Power BI Solution?[…]

Conditional Column in Power BI using Power Query; You can do anything!

There are many scenarios that you might want to implement a conditional expression. When the conditional expression’s logic is on a row-by-row basis, the best is doing it in Power Query rather than DAX (there are exceptions always), The Add Conditional Column in Power Query is a very helpful option, but often many people find Read more about Conditional Column in Power BI using Power Query; You can do anything![…]

Organize Power BI DAX Measures in Folders

Although very simple, still I see many Power BI reports with no organized way of separating measures. When you use Power BI for a while, you will gradually have more DAX measures and calculations, and having them organized under folders is always helpful. In this very short article, I’ll explain how you can use Display Read more about Organize Power BI DAX Measures in Folders[…]

Budget vs. Actual Model in Power BI: Calculations and DAX

In the previous article, I explained how you can build a data model for budget vs. actual, where the grain of the two fact tables is different. The model works perfectly as a star schema. As long as you slice and dice data in the level of granularity that both tables support, then you don’t Read more about Budget vs. Actual Model in Power BI: Calculations and DAX[…]

Budget vs Actual: Zero Complexity Model in Power BI

When I explain the Star Schema and best practices of data modeling in Power BI, Often I get questions such as what if we want to have budget and actuals in the same data model? what if there are two tables with different granularity? We cannot solve it with simple data modeling and relationships, this Read more about Budget vs Actual: Zero Complexity Model in Power BI[…]

Introduction to Charticulator: Create Custom Visual – Part 1

In the last post different ways of creating custom, visuals have been explained. In this post, I will show how to use Charticulator for creating a custom visual in Power BI. As mentioned, first navigate to the below link: https://Charticulator.com Next, you need to click on the Launch Charticulator. This will navigate you to the Read more about Introduction to Charticulator: Create Custom Visual – Part 1[…]

Create a Profiling Report in Power BI: Give the End User Information about the Data

Most of the time, you would like to know how the data quality looks like in your tables. Although, this is a process that you mainly check at the time of data preparation, having such report for end users, is also helpful, because sometimes they see an odd outcome, and wonder where this is coming Read more about Create a Profiling Report in Power BI: Give the End User Information about the Data[…]

Why my Power BI Matrix or Table Visual is SLOW

You have created a Power BI report with many visualizations and calculations, however, it is slow! And the slowest part of that is the report page with a matrix or table visual in it! Why that visual is so slow? Is this the problem of Visual in Power BI? or Power BI problem at all? Read more about Why my Power BI Matrix or Table Visual is SLOW[…]

Build Your First Star Schema Model in Action: Power BI Modeling Basics

Dimensions and Fact tables are the two essential parts of building a data model, and their relationship in the form of Star Schema is the best practice of doing the modeling. However, these are all theories until you really experience it in a real-world example. In this article, I want to put everything you learned Read more about Build Your First Star Schema Model in Action: Power BI Modeling Basics[…]